Register For Our Mailing List

Register to receive our free weekly newsletter including editorials.

Home / 579

An intriguing theory explaining persistent LIC discounts

[Editor: the following is an extract from Bell Potter's latest quarterly report on the latest trends in LICs and LITs.]

Paying for the beta

The emergence of trading discounts amongst closed-ended funds has become a challenge for investors and managers alike, with the combination of market rallies and interest rate volatility fueling the growth of trading discounts to historic wide levels for many Listed Investment Companies (LICs). Whilst trading activity for LICs have been volatile, investors look to the relationship between returns from the LIC and the benchmark in determining the dislocation from NTA.

The relationship between LIC and Listed Investment Trust (LIT) returns and the market can be captured through ‘beta’, being a useful measure in understanding the riskiness of an investment. A beta of 1 reflects returns which are just as volatile as the market, with a value greater than 1 indicating greater volatility relative to the market portfolio. The relationship between LIC/LIT beta and its corresponding trading premium or discount over the last three years, is depicted in Figure 1, noting many domestic listed strategies exhibit risk-return characteristics close to their respective benchmarks.

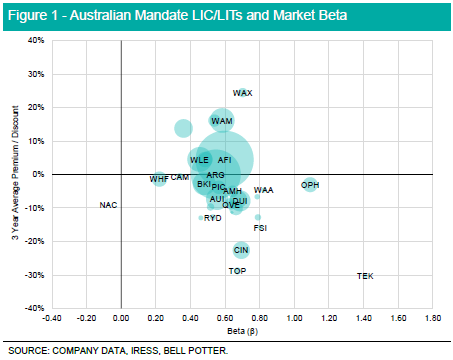
Amongst LICs with a domestic equity mandate, investors continue to preference funds with a benchmark like risk return relationship, highlighted by the majority of LICs capturing a market beta of between 0.5 to 0.8, with larger market capitalisation listed products trading near NTA. Smaller and more concentrated portfolios demonstrate dislocations from the market beta and NTA. This is headlined by the Australian Foundation Investment Company (AFI) and Argo Investments (ARG) which report a 3-year average beta of ~0.6, signifying a reduction in market risk compared to their respective benchmarks.

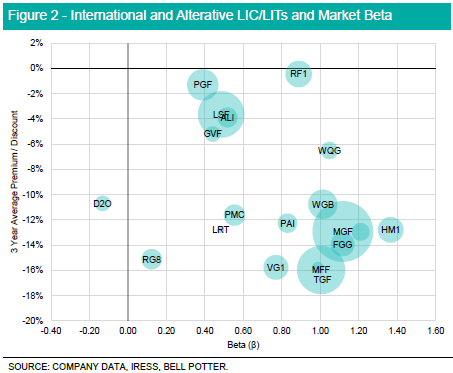
A similar relationship can be inferred amongst international and alternative mandated listed closed ended funds, with the average trading discount for LIC/ LITs closing as beta rises towards 1. Most listed products with this mandate trade on a beta of less than 1, reflecting a return profile which is less volatile than the underlying index. Divergence from NTA is more prevalent in listed products with international and alternative mandates, with markets unable to close trading discounts irrespective of historical return performance. The Regal Investment Fund (RF1) best captures market volatility whilst trading near NTA, reflected by an average beta of 0.89 and underpinned by strong performance in the LITs small company and global alpha strategies over the last 12 months.

The relationship between historical market discounts and beta indicates markets are better able to price index replicating strategies, with trading discounts becoming the result of divergence from the market portfolio. This relationship is best demonstrated with Australian equity mandated LIC/LITs, whilst International and Alternative mandates have less of a defined relationship. Outside of this the flow of additional capital towards exchange traded funds (or ‘ETFs’) has coincided with the recent emergence of trading discounts, with the sector reporting a FUM CAGR of circa 35%. Whist ETFs remain a popular alternative in capturing market returns, similar exposure exists in the LIC/LIT sector given multiple products hold broad market mandates, whilst exhibiting risk-return characteristics similar to the market portfolio, notwithstanding the impact of trading discounts, dividends and manager risk in overall returns.

It's all the same to me

Diversification is key in looking at LICs as investors want to minimize the degree of correlation in returns between assets in order to reduce overall portfolio volatility. Correlation is the degree in which two assets move together, captured by a value between -1 and 1. The higher the correlation between two assets, the closer they move in line with each other, with a value of 1 capturing perfect positive correlation, and a value of -1 capturing perfect negative correlation. In assessing the LIC/LIT market, assets which report a high correlation offer lower diversification benefits when held together in a portfolio, compared to assets which exhibit lower correlation.

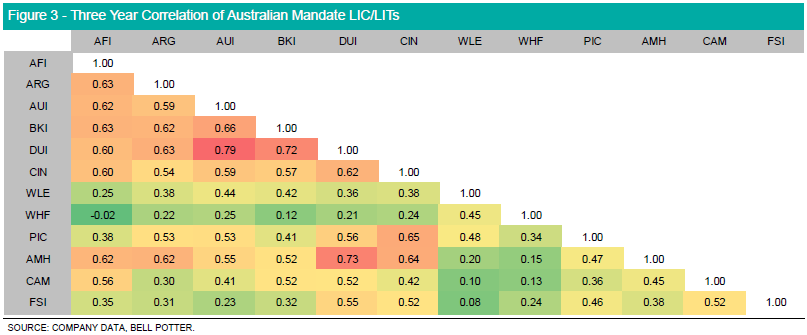
Amongst LIC/LITs with Australian equity mandates, Whitefield Industrials (WHF), Clime Capital (CAM) and Flagship Investments (FSI) exhibit a weak positive correlation against other listed products. The strongest positive correlation is held between Australian United Investment (AUI) and Diversified United Investment (DUI) given both companies share similar investment philosophies. Furthermore, LICs which hold a large cap only mandate report a strong positive correlation given there is often high overlap between underlying portfolio investments.

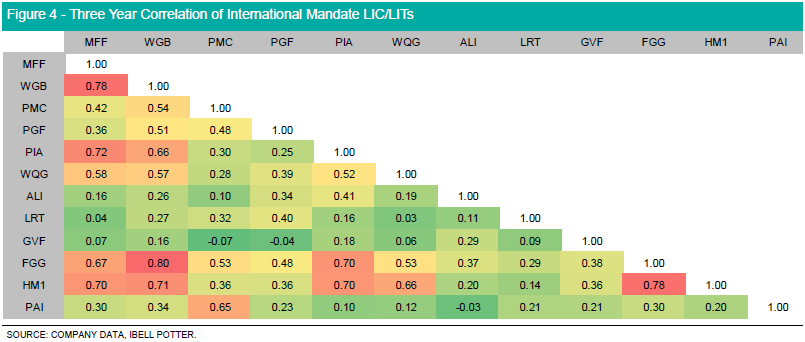
Looking at LIC/LITs with International equity mandates, the Global Value Fund (GVF) exhibits low historical correlation, given returns are driven by the managers discount capture strategy. Together with GVF, both Argo Infrastructure Limited (ALI) and Lowell Resources Trust (LRT) report a low correlation with their peers given their sector specific exposures. Contrastingly, both MFF Capital (MFF) and WAM Global (WGB) demonstrate a return high correlation given both LICs hold similar thematic and geographic allocations in their respective portfolios.
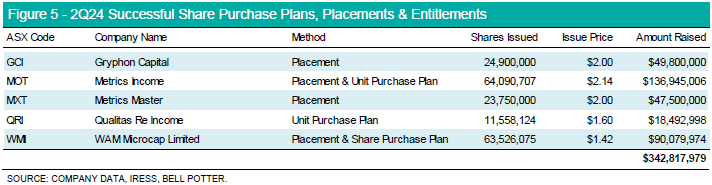
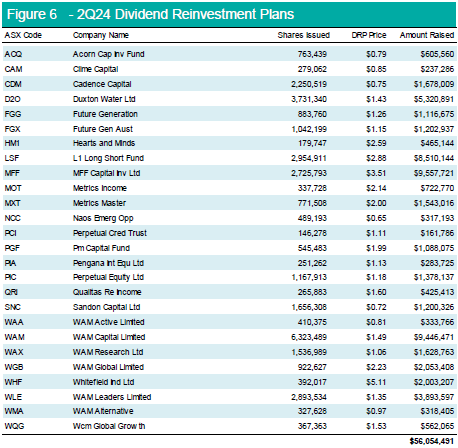
Capital raisings

Strong market conditions provided a backdrop for LICs and LITs to raise incremental capital. A total of $398.87m was raised via the secondary market through Dividend Reinvestment Plans (DRPs), Stock Options and Placements.

The majority of additional capital stemmed from fixed income LIT managers on the back of stronger demand from the market, given LITs under this mandate trade at a weighted average premium of 1.48% versus the sector at a 7.33% discount. Managers have taken the opportunity to offer the ability to subscribe to additional units in the trust at NTA, allowing investors to capture value during a period of trading at a premium to NAV. The increased appetite for alternative income strategies comes during an elevated interest rate environment, coupled with shifting appetite from traditional lenders in participating in commercial lending.

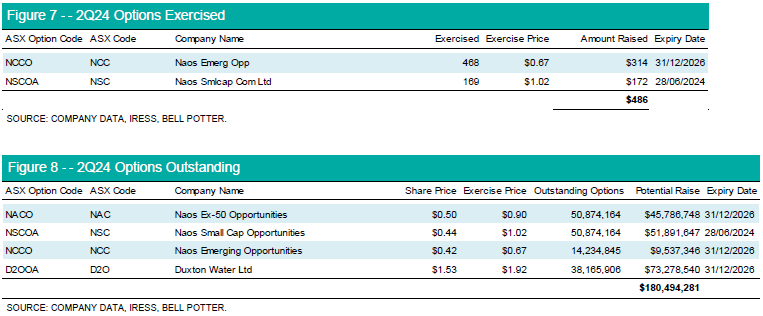
Option exercises were a negligible source of additional capital with most trading deeply out of the money at circa 20-50%.


Kion Sapountzis is an Investment Analyst at Bell Potter Securities. This information contains general information only and has been prepared without taking into account your objectives, financial situation or needs.


5 Comments
GFB
October 04, 2024

As a dividend buyer, I don't really care about the premium or discount on any given day for my LIC holdings. If the fund has coverage for the dividend, then that's what's important to me. Sure, having growth on your capital is nice, but it's the steady and rising DPS that I'm there for.

AM
September 29, 2024

The article suggests that there is a relationship between premium/discount vs Beta.
However, I can’t see any evidence of that relationship in the top two charts.
Am I missing something here?

NR
September 27, 2024

re afic and argo - have a look at the buy/ sell spread. i guess newcomers who bought in during covid are now trying to cash out and move to cash/ term deposit. once this cohort is out price should get back to normal. they're silly enough to sell $1 worth of asset for 80 cents.

one of afic's board members recently bought $1million worth - this should give you confidence.

both are now publishing weekly nta which should help also.

PN
September 27, 2024

Thanks for the article, although I'm not sure what to make of it......
I'm an AFI and ARG shareholder, two of our biggest blue chip, conservative, lease volatile LIC's, and they've been trading at a discount for over 18 months, currently at their biggest discounts of +11%...doh.
Love to see the discount start closing

CC
September 26, 2024

but AFI and ARG discounts have blown out to 11% despite their low volatility


Leave a Comment:

RELATED ARTICLES

ETFs are the Marvel of listed galaxies, even with star WAR

Finding opportunities in listed global funds

Four ways to invest in the same fund and save money

banner

Most viewed in recent weeks

The case for the $3 million super tax

The Government's proposed tax has copped a lot of flack though I think it's a reasonable approach to improve the long-term sustainability of superannuation and the retirement income system. Here’s why.

7 examples of how the new super tax will be calculated

You've no doubt heard about Division 296. These case studies show what people at various levels above the $3 million threshold might need to pay the ATO, with examples ranging from under $500 to more than $35,000.

The revolt against Baby Boomer wealth

The $3m super tax could be put down to the Government needing money and the wealthy being easy targets. It’s deeper than that though and this looks at the factors behind the policy and why more taxes on the wealthy are coming.

Meg on SMSFs: Withdrawing assets ahead of the $3m super tax

The super tax has caused an almighty scuffle, but for SMSFs impacted by the proposed tax, a big question remains: what should they do now? Here are ideas for those wanting to withdraw money from their SMSF.

The super tax and the defined benefits scandal

Australia's superannuation inequities date back to poor decisions made by Parliament two decades ago. If super for the wealthy needs resetting, so too does the defined benefits schemes for our public servants.

Are franking credits hurting Australia’s economy?

Business investment and per capita GDP have languished over the past decade and the Labor Government is conducting inquiries to find out why. Franking credits should be part of the debate about our stalling economy.

Latest Updates

Superannuation

Here's what should replace the $3 million super tax

With Div. 296 looming, is there a smarter way to tax superannuation? This proposes a fairer, income-linked alternative that respects compounding, ensures predictability, and avoids taxing unrealised capital gains. 

Superannuation

Less than 1% of wealthy families will struggle to pay super tax: study

An ANU study has found that families with at least one super balance over $3 million have average wealth exceeding $19 million - suggesting most are well placed to absorb taxes on unrealised capital gains.   

Superannuation

Are SMSFs getting too much of a free ride?

SMSFs have managed to match, or even outperform, larger super funds despite adopting more conservative investment strategies. This looks at how they've done it - and the potential policy implications.  

Property

A developer's take on Australia's housing issues

Stockland’s development chief discusses supply constraints, government initiatives and the impact of Japanese-owned homebuilders on the industry. He also talks of green shoots in a troubled property market.

Economy

Lessons from 100 years of growing US debt

As the US debt ceiling looms, the usual warnings about a potential crash in bond and equity markets have started to appear. Investors can take confidence from history but should keep an eye on two main indicators.

Investment strategies

Investors might be paying too much for familiarity

US mega-cap tech stocks have dominated recent returns - but is familiarity distorting judgement? Like the Monty Hall problem, investing success often comes from switching when it feels hardest to do so.

Latest from Morningstar

A winning investment strategy sitting right under your nose

How does a strategy built around systematically buying-and-holding a basket of the market's biggest losers perform? It turns out pretty well, so why don't more investors do it?

Sponsors

Alliances

© 2025 Morningstar, Inc. All rights reserved.

Disclaimer
The data, research and opinions provided here are for information purposes; are not an offer to buy or sell a security; and are not warranted to be correct, complete or accurate. Morningstar, its affiliates, and third-party content providers are not responsible for any investment decisions, damages or losses resulting from, or related to, the data and analyses or their use. To the extent any content is general advice, it has been prepared for clients of Morningstar Australasia Pty Ltd (ABN: 95 090 665 544, AFSL: 240892), without reference to your financial objectives, situation or needs. For more information refer to our Financial Services Guide. You should consider the advice in light of these matters and if applicable, the relevant Product Disclosure Statement before making any decision to invest. Past performance does not necessarily indicate a financial product’s future performance. To obtain advice tailored to your situation, contact a professional financial adviser. Articles are current as at date of publication.
This website contains information and opinions provided by third parties. Inclusion of this information does not necessarily represent Morningstar’s positions, strategies or opinions and should not be considered an endorsement by Morningstar.