The end of another decade is almost upon us! Each decade tends to have its dominant investment themes. The 1970s was the era of oil price spikes, US dollar collapse, high inflation and unemployment. The 1980s was Reagan/Thatcher inflation-busting recessions, Hawke/Keating reforms, the ‘greed is good’ boom, then the 1987 crash. The 1990s saw the Asian currency crisis, the Russian default and the ‘irrational exuberance’ dot-com boom. The 2000s had the ‘tech wreck’, the global credit/China boom then the sub-prime crash and GFC.
Nobody could have predicted any of these at the start of each decade.
How did we go in the 2010s?
The 2010s has been a decade of change and similarly unpredictable events. Many things we now take for granted were unthinkable at the start of the decade. Instagram, ‘Instagram influencers’ and YouTube channels as lucrative ‘careers’, Snapchat, Pinterest, WhatsApp, Uber, Deliveroo, Airbnb, Spotify, iPads, tablets, Kindle, bitcoin, Square, pay wave, smart watches, fitness trackers, Bluetooth, USB flash drives, GPS on smartphones, 4G, streaming, self-driving cars, drones, and even test cricket played at night with a pink ball!
We have Trump in the White House, Britain in ‘Brexit’ chaos, combat warfare on the streets of Hong Kong, rising nationalistic fervour and extreme right and left-wing politics across the world, the US withdrawing from the multi-lateral world and China expanding militarily and economically far beyond its borders.
For investors it has also been a decade of surprises. At the start of the 2010s decade the world looked like it was on the way to recovering from the US sub-prime crisis and global banking crisis. Ten years later, the US, Europe and Japan are still on life support in the form of unprecedented monetary and fiscal stimulus, but it has done little to stimulate economic growth or inflation. All it has done is fuel asset price bubbles and mountains of debt everywhere. The winners have been asset owners, lenders and emerging country wage earners, while the losers have been savers, renters, traditional retailers and developed country wage earners.
Two unusual features in Australian shares
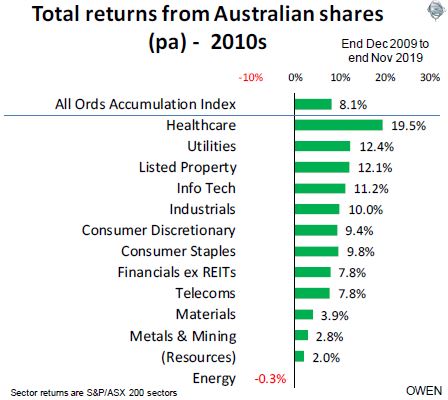
The chart below shows annualised total returns (including dividends) from the different sectors of the Australian share market since the end of 2009 to the end of November 2019 (almost a decade). The two largest sectors – financials and miners – have dragged on the market over the decade.
There are two unusual features.
The first is that the 8% total returns per year from the overall market has been well below its long term average of around 10% per year. What is surprising is that the poor results were achieved in an era of very low interest rates and inflation.
The second unusual feature is the wide dispersion of results between different sectors.
(The numbers expressed below for individual companies are total share price gains over the decade, not annualised, so they should be compared to the broad market share price gain of +42% for the decade. Yes, only 42% growth (or 3.6% per year) for the decade).
Healthcare
Healthcare has been the star sector for the decade. CSL is up +773% and is about to take the lead from CBA as the most valuable company on the ASX. ResMed is up +274%, Cochlear +239%, Ramsay +570%, Ansell +171%, and Sonic +99%. Despite these successes, the sector is notoriously speculative and accident-prone, with many more losers than winners. Some companies had their brief time in the sun, like Mesoblast and Primary Health care (now ‘Healius’), but most of the nearly 200 healthcare stocks that were on the ASX at the start of the decade have gone nowhere (still waiting or their big breakthrough) or have run out of money and disappeared.
Utilities
Utilities stocks have also done well. Their relatively stable, regulated cash flows have benefited enormously from the great collapse in bond yields over the past decade. APA is up +214%, AusNet +90%, Spark +57%, but AGL is up only +41%.
Technology
The tech sector has had a good decade. Carsales is up +207%, Altium + 14,000%, Technology One +1,003%, Infomedia +563%, Praemium +256%, and Seek (classified as an ‘industrial’) +236%. The tech sector is like healthcare in having a lot more losers than winners. At the other extreme is Silex Systems down -90%, but most of the other 110 tech stocks that were listed 10 years ago have remained dormant or disappeared. Computershare, a survivor from the last tech boom in the 1990s, is up just +55% this past decade.
Listed property
The listed property sector is in the winners list for the decade but it suffered badly in the GFC. Many of the best property trusts are still well behind the rest of the market if measured at a starting point before the GFC hit.
Industrial property specialist Goodman has been the star +368%, benefiting from the shift from physical shops to online shopping. Bunnings +129% has been a rare exception of retail success despite the Amazon effect. The smartest operator in retail property is Frank Lowy (Westfield) and he sold out of the retail trust of Westfield in 2014 and out of the development arm this year.
Industrials
In industrial, transport has done well: Qantas +144%, Transurban +177%, Brambles +85%. Also building products: Amcor +145%, James Hardie +241%.
Rounding out the laggards is Telstra, up just 32% in the last 10 years, but still 60% below its peak 20 years ago.
Banks and financials
CBA is up just 47% in 10 years, but the rest of the Big 4 have done nothing and AMP is down -71%. The star has been Macquarie, up +185% for the decade. Among the insurers, IAG +99% and Suncorp +54% have easily beaten the perennially accident-prone QBE -50%, which was once a top 10 stock.
Resources
Miners are driven by commodity cycles: Copper -20%, Nickel -28%, Aluminium -18%, Lead -20%, Tin -2%, Zinc -12% for the decade.
BHP’s share price is down -11% (or down -5% including the free shares in spin off South32), but RIO is up 29%. Fortescue is a genuine star +119%. Gold mining heavyweight Newcrest is down -13%. Among energy are Origin -48%, Woodside -27%, Santos -42%, Worley -48%, while Oil Search is ahead +21%.
Retailers
Also struggling over the past decade were the retailers. Myer is barely surviving after being worked over by private equity, and it will probably suffer the same fate as Dick Smith. DJs has been taken over by South African Woolworths and is also on its last legs. Harvey Norman, the star of decades past, is flat over the 2010s decade. Even JB – arguably the best of the retailers – is up just +66% over 10 years. Woolworths is up +42% and Metcash down -21%. The winners have been the online players, like Domino’s Pizza up +878%.
Who will be the winners and losers over the next decade?
The miners and banks are driven by macro shifts. For miners it is the big picture commodities cycles, and for the banks it is demographic cycles, regulatory cycles, competitive regimes and interest rate or credit cycles.
Each industry has its own big picture trends, like the ‘Amazoning’ of retailing. What determines the winners and losers is the the quality of management. This includes the ability to capitalise on opportunities, but often it is a simple as not doing dumb things like undertaking huge ego-boosting acquisitions and expansion projects at the tops of booms. It’s a disease that afflicts most companies in all industries.
The winners in the next decade will be the companies run by visionaries who are supported by highly-skilled directors with real experience in running companies themselves and who add value rather than just ticking compliance boxes.
Ashley Owen is Chief Investment Officer at advisory firm Stanford Brown and The Lunar Group. He is also a Director of Third Link Investment Managers, a fund that supports Australian charities. This article is for general information purposes only and does not consider the circumstances of any individual.