Register For Our Mailing List

Register to receive our free weekly newsletter including editorials.

Home / 53

Bill & Ted’s (Not So) Excellent Sequencing Adventure

In the world of investments the start of a new year is a time of heightened activity, as performance data from the previous year becomes available. For example, balanced options (between 60% and 76% in growth assets) have, on average, generated an annualised return of 7.1% p.a., net of investment fees and tax, for the ten calendar years to 31 December 2013. This equates to a real (after-tax) return of 4.2% p.a. over the period. Given a typical real return objective of 3– 4% p.a. over rolling multi-year periods, this result for the ‘average’ balanced super option would seem highly satisfactory from a pure investment perspective.

An in-depth review, however, finds only one calendar year (8% in 2007) was close to the annualised average of 7.1%. More commonly, high return years (e.g., 16.3% in 2013) were balanced by low return years (e.g., -19.7% in 2008). How ‘average’, therefore, are long-term average returns? How closely do they match returns as experienced by individual members? More importantly, does it matter if they don’t?

Peeking under the hood of a retirement projection

To answer these questions let’s look at a real-world scenario incorporating actual returns over the 2004 to 2013 period. We examine a hypothetical example of two super fund members, William and Edward. Both turned 55 on 1 January 2014 and both intend to retire in ten years at age 65. Their circumstances are identical: super balance of $215,000 on 1 January 2014, and income of $85,000 escalating at 4% p.a., on which employer super guarantee contributions (as currently legislated) are paid, with no further contributions. For ease of computation, non-investment related fees and insurance premiums are ignored in this example.

Seeking advice, both men discover that they should aim for a retirement super balance of $430,000 in real (2013) dollars. The advisor’s projections indicate that if their respective super options generate an annualised return of 7.1% p.a. and inflation matches the average for the last ten years, they should retire with super of $432,000 in real dollars.

Rather than the average 7.1% p.a. return, let’s model outcomes with year-to-year variability based on the historical sequence of calendar returns from 2004 to 2013.  We’ll change only one factor: re-ordering this sequence such that Edward’s returns are ordered from worst to best over the period, whilst William’s are a mirror image, with his worst return in year ten.

The results for this modelling exercise are depicted below:

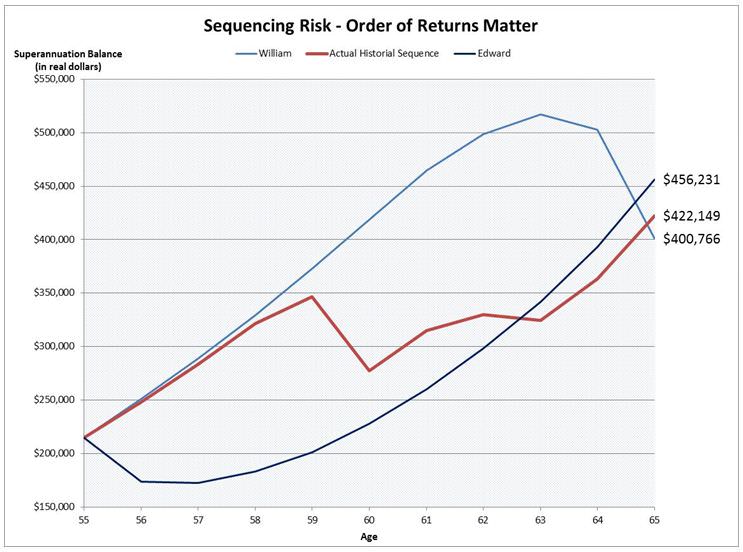
The red path shows how Edward and William’s super would have grown if the returns from 2014 to 2023 matched exactly those from 2004 to 2013 in size and chronological order. However, once we change the return sequence as described above, both end up with retirement balances significantly different to the projection of $432,000, and some $55,500 different from each other. Why?

The answer is sequencing risk – the risk to an individual’s wealth of receiving the worst returns in their worst order. Both Edward and William experience a -19.7% return once in their final ten years before retirement. It is William who is affected to a far larger degree. He experiences his worst return (-19.7%) at the point of maximum portfolio size, decimating his year 10 starting balance of $503,000. Edward’s -19.7% return year occurs off a starting balance of $215,000.

William’s worst return year also coincides with his largest cash flow into superannuation, with some $12,800 of net nominal contributions made in his tenth year, compared to some $7,000 in Edward’s first year. These aspects of sequencing risk have come to be known as the ‘portfolio size effect’ [Basu and Drew, 2009]: sequencing risk increases with the magnitude of dollars at risk, reaching its zenith at or near the end of an investment time horizon.

The above example demonstrates that returns as experienced by individuals are cash flow sensitive and path dependent. Both the timing of cash flows and the order of returns matter in producing the final dollar outcome (terminal wealth) from which a retirement lifestyle is funded.

Investment risk and sequencing risk are related, but not the same thing. It is simultaneously possible for an individual to achieve an investment return objective over an entire investment horizon (as with the 7.1% p.a. ten year annualised return) and not meet a terminal wealth objective (the unfortunate William) due to the order of returns on their particular path to retirement.

Ramifications for superannuation

Sequencing risk creates a particularly troublesome dilemma in retirement planning. At its core, sequencing risk is a function of portfolio volatility: reduce it and you mitigate the sequencing risk effect. Do this by down-weighting growth assets and you might not have the growth engine you need to combat inflation and longevity risk through a retirement of uncertain length. Getting the balance right is a very delicate dance, and a challenge for the entire superannuation sector.

Many MySuper funds have implemented lifecycle strategies that periodically de-risk members once in the retirement risk zone. These developments are in their infancy, with their effectiveness hobbled by operational complexity and regulatory constraints. They are a mass-personalised solution, segmenting members into groups that de-risk together along a pre-determined ‘glidepath’, not an individualised response to sequencing risk. Enhancements continue to be made in this area.

Financial planners can help individuals negotiate their personal retirement risk zone, focussing clients on achieving wealth objectives and income goals, incorporating superannuation into the totality of financial resources available for retirement.

Sequencing risk will be a sizeable challenge for SMSFs, which tend to have a significant weighting to Australian shares that pay tax-advantaged franked dividends. Whilst this might boost after-tax returns in the accumulation phase, portfolio volatility may be dominated by equities. A tendency to defer the sale of assets with unrealised capital gains tax liabilities until in pension mode further exacerbates the problem. In short, SMSF trustees might inadvertently be allowing the tax tail to wag the sequencing risk dog.


Harry Chemay is a Certified Investment Management Analyst and a consultant across both retail and institutional superannuation. He has previously practised as a specialist SMSF advisor, and as an investment consultant to APRA-regulated superannuation funds. The example used in this article appears for illustrative purposes only, and is not intended to be taken as personal or general financial advice.


2 Comments
Harry Chemay
March 20, 2025

Thanks for your contribution to the debate Amara. It is much appreciated.

You are right that sequencing risk and investment risk are different things, albeit loosely connected via the commonality of portfolio volatility.

The reason why investment professionals find sequencing risk hard to grasp is because they are trained to see the investment world through the lens of Time Weighted Returns (TWR), which neutralise the impact of cashflows by design, not Money Weighted Returns (MWR), where both the quantum and timing of cashflows are reflected in the calculated return.

As I'm sure you'd know, APRA-regulated super fund performance metrics (NIRs) are also derived using a TWR methodology (even though PE returns are generally provided as IRRs).

Your questions had me reaching back into the early drafts of this piece (it went through 14 iterations) as well as the modelling upon which it was based.

Here’s some material from an earlier version that didn’t make the final piece (as I felt it was too technical for a lay audience):

“How ‘average’ therefore are long-term average returns as calculated by super funds, and how closely do they match returns as experienced by individual members? To answer these questions one must first understand how super funds calculate option returns.

Option returns are most often an amalgamation of other returns which, by convention, are calculated according to a time-weighted return (TWR) methodology. These returns are geometric mean returns, in that they incorporate the effect of compounding over time. This methodology does not however take account of specific cash-flows, such as the timing of contributions or benefit payments, and instead nullifies their impact on the returns calculated.

In superannuation however, a growing stream of contributions are invested by design over an extended period of time. The need to consciously manage for sequencing risk is increasingly apparent as demographic forces push more people into the ‘Retirement Risk Zone’; loosely defined as the last ten years to retirement and the first ten years in it.

Time-weighted returns are a poor measure of individual investment performance. Using a money-weighted return methodology (MWR or IRR) to explicitly incorporate the size of cashflows and their timing over the whole ten year period, Ted is found to have generated a return of 7.8% p.a. whilst Bill generated a return of 6.2% p.a. These money-weighted returns are a more precise assessment of the investment outcomes as actually experienced by Ted and Bill respectively.”

Hope this helps bolster your case to your colleagues. Keep fighting the good fight! Harry


Leave a Comment:

RELATED ARTICLES

Three underrated investment risks in retirement

Unpacking investment risk in superannuation

What financial risks do retirees face?

banner

Most viewed in recent weeks

Are LICs licked?

LICs are continuing to struggle with large discounts and frustrated investors are wondering whether it’s worth holding onto them. This explains why the next 6-12 months will be make or break for many LICs.

Retirement income expectations hit new highs

Younger Australians think they’ll need $100k a year in retirement - nearly double what current retirees spend. Expectations are rising fast, but are they realistic or just another case of lifestyle inflation?

Welcome to Firstlinks Edition 627 with weekend update

This week, I got the news that my mother has dementia. It came shortly after my father received the same diagnosis. This is a meditation on getting old and my regrets in not getting my parents’ affairs in order sooner.

  • 4 September 2025

5 charts every retiree must see…

Retirement can be daunting for Australians facing financial uncertainty. Understand your goals, longevity challenges, inflation impacts, market risks, and components of retirement income with these crucial charts.

Why super returns may be heading lower

Five mega trends point to risks of a more inflation prone and lower growth environment. This, along with rich market valuations, should constrain medium term superannuation returns to around 5% per annum.

The hidden property empire of Australia’s politicians

With rising home prices and falling affordability, political leaders preach reform. But asset disclosures show many are heavily invested in property - raising doubts about whose interests housing policy really protects.

Latest Updates

Investment strategies

Why I dislike dividend stocks

If you need income then buying dividend stocks makes perfect sense. But if you don’t then it makes little sense because it’s likely to limit building real wealth. Here’s what you should do instead.

Superannuation

Meg on SMSFs: Indexation of Division 296 tax isn't enough

Labor is reviewing the $3 million super tax's most contentious aspects: lack of indexation and the tax on unrealised gains. Those fighting for change shouldn’t just settle for indexation of the threshold.

Shares

Will ASX dividends rise over the next 12 months?

Market forecasts for ASX dividend yields are at a 30-year low amid fears about the economy and the capacity for banks and resource companies to pay higher dividends. This pessimism seems overdone.

Shares

Expensive market valuations may make sense

World share markets seem toppy at first glance, though digging deeper reveals important nuances. While the top 2% of stocks are pricey, they're also growing faster, and the remaining 98% are inexpensive versus history.

Fixed interest

The end of the strong US dollar cycle

The US dollar’s overvaluation, weaker fundamentals, and crowded positioning point to further downside. Diversifying into non-US equities and emerging market debt may offer opportunities for global investors.

Investment strategies

Today’s case for floating rate notes

Market volatility and uncertainty in 2025 prompt the need for a diversified portfolio. Floating Rate Notes offer stability, income, and protection against interest rate risks, making them a valuable investment option.

Strategy

Breaking down recent footy finals by the numbers

In a first, 2025 saw AFL and NRL minor premiers both go out in straight sets. AFL data suggests the pre-finals bye is weakening the stranglehold of top-4 sides more than ever before.

Sponsors

Alliances

© 2025 Morningstar, Inc. All rights reserved.

Disclaimer
The data, research and opinions provided here are for information purposes; are not an offer to buy or sell a security; and are not warranted to be correct, complete or accurate. Morningstar, its affiliates, and third-party content providers are not responsible for any investment decisions, damages or losses resulting from, or related to, the data and analyses or their use. To the extent any content is general advice, it has been prepared for clients of Morningstar Australasia Pty Ltd (ABN: 95 090 665 544, AFSL: 240892), without reference to your financial objectives, situation or needs. For more information refer to our Financial Services Guide. You should consider the advice in light of these matters and if applicable, the relevant Product Disclosure Statement before making any decision to invest. Past performance does not necessarily indicate a financial product’s future performance. To obtain advice tailored to your situation, contact a professional financial adviser. Articles are current as at date of publication.
This website contains information and opinions provided by third parties. Inclusion of this information does not necessarily represent Morningstar’s positions, strategies or opinions and should not be considered an endorsement by Morningstar.