Register For Our Mailing List

Register to receive our free weekly newsletter including editorials.

Home / 137

Chasing dividends often overlooks growth

A year ago in Cuffelinks, we wrote about the bubble in stocks (and inevitably property) inflated by the baby boomer’s desperate search for yield. We described the pursuit of yield as a fad. We were not surprised to watch investors rushing into higher yielding banks and Telstra but we were shocked to hear of investors buying BHP for its ‘progressive’ dividend.

The bubble has burst but the fad lives on, and banks have wiped billions from retirees’ wealth while BHP has backed away from its ‘progressive’ dividend position. We wrote:

“The pursuit of yields through dividend-paying shares is analogous to a mindless heard of bison stampeding towards a cliff. Wall Street will sell what Wall Street can sell. Right now selling yield and income is the easiest game in town. Investors are predisposed to hearing the siren song of income and advisers and product issuers are rushing to feed the hoards. There are only a few who are willing to question the conventional thinking about pursuing yield at all costs.

My belief is that the pendulum will swing back and this time is no different to other periods of unbridled optimism…”

Of course much has changed. BHP has fallen 35%, CBA declined 26% from its interim peak to trough, NAB 28% and Telstra 23%. What has not changed is retirees’ need for income. But is there a better way to generate income that suffers less from the massive tides associated with mass investor hype and hysteria?

High payouts may generate income but limit growth

I believe there is and some basic arithmetic can demonstrate a superior choice even for those requiring income.

Table 1. High ROE company paying out 100% of earnings
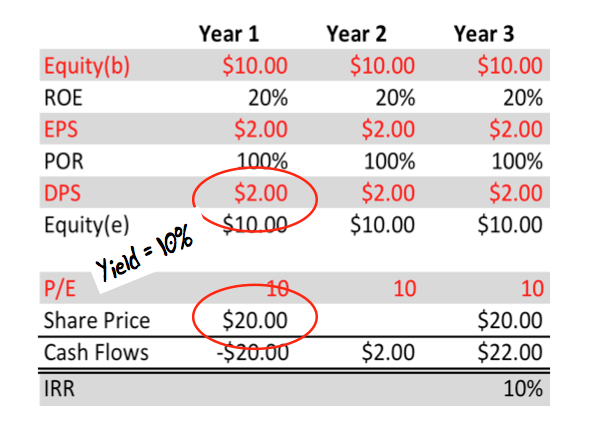
Let’s start with the company described in Table 1 by making some minor assumptions. First, we assume the business is able to generate a return on equity (ROE) of 20% sustainably. Second, we can buy and sell the shares on an unchanged price earnings (P/E) ratio of 10 times. The final assumption is a payout ratio of 100%.

We have assumed no increases in debt (which increases the risks) and no dilutionary share issues. The company’s only source of growing equity is retained profits.

Table 1 demonstrates that an investor who purchases and sells shares in a company with an attractive rate of return on equity, a constant P/E and a payout of 100% will receive as their return an internal rate equivalent to the dividend yield at the time the shares are purchased. This represents the upper bound of their return – the dividend yield is the best outcome, unless they speculate successfully on an expansion of the P/E ratio. For that to occur, sentiment or popularity towards the company’s shares would have to change and be correctly predicted.

In more simple terms, if you chase a high yield and the company pays all of its earnings out as a dividend, the high yield is about all you should expect. Perhaps that is what investors who chased the banks, Telstra and BHP are now finding out.

Lower payout ratios can improve total returns

In Table 2, the only item that has changed is the payout ratio, which is now zero. Of course this has a major impact on everything else.

Table 2. High ROE company paying out 0% of earnings
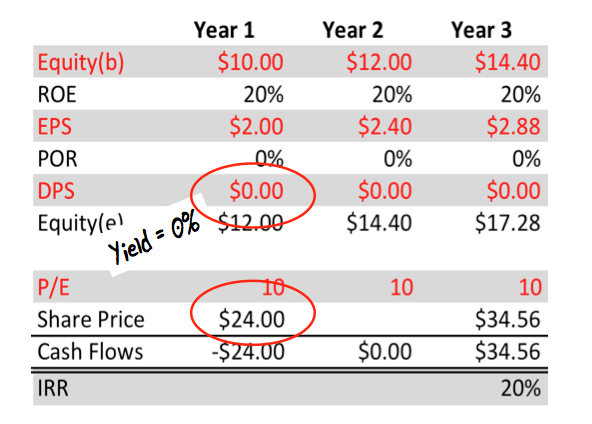
This company pays none of its earnings out as a dividend. An investor who buys and sells the shares on the same P/E ratio will experience capital and earnings growing by the rate of the retained ROE. The constant P/E ratio means the IRR to the investor will equal the return on equity of 20%.

My proposal is that investors who chase higher yields, especially from companies that pay the bulk of their earnings out as dividends, are missing out on major financial benefits. The corollary is that company boards who acquiesce to shareholder demands for higher dividend payout ratios – especially where they are able to employ retained earnings at high rates of return – are ultimately doing their shareholders and their share price a disservice, as shown in Table 3.

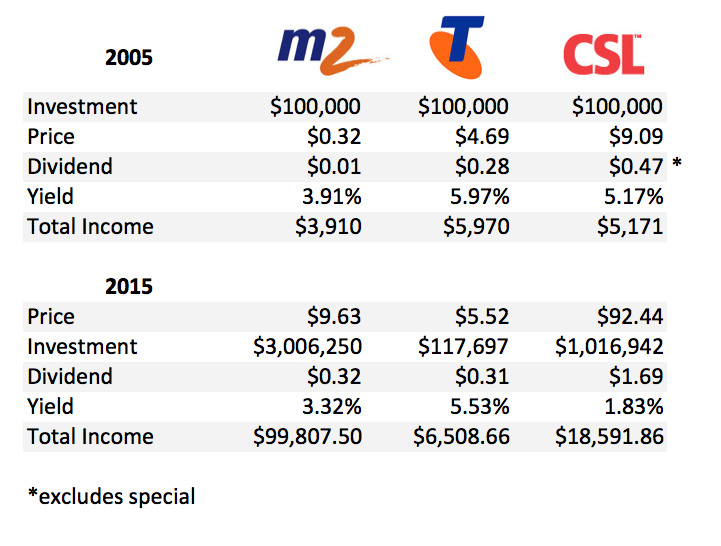
Table 3. Power of true blue-chips (not Telstra)
It’s not only about dividend yields

Investors in 2005 who invested $100,000 in the higher, 5.9%-yielding Telstra shares could have invested $100,000 in the M2 Group. The major difference between these two companies was not just their yield. Telstra’s management elected to pay the bulk of the company’s earnings out as a dividend. Indeed, under Solomon Dennis Trujillo, Telstra’s dividend exceeded earnings over a number of years. While Telstra’s payout ratio was near 100%, M2 Group’s payout ratio was much lower. Table 2 revealed the desirable impact on returns from investing in a company that can retain earnings and reinvest those earnings at a high ROE. Table 3 puts that into practice.

Investing $100,000 in Telstra in 2005 for ten years has produced an investment of about $117,000 or an average annual compounded capital return of 1.5% p.a. Many of you will jump to the defence of Telstra and point out that I have excluded the dividends from the calculations. But this article is about retirees who have been chasing income to spend on food and clothing and other essentials like BMWs and annual overseas holidays, so I have not assumed a reinvestment of dividends.

In 2005, the 5.9% yield on Telstra shares equated to $5,900 of fully franked income. Telstra has increased the dividend since then from 28 cents to 30 cents per share and the low increase reflects that fact that profits have not grown markedly. In any event, the income on the $117,000 investment would be about $6,500.

Contrast this with M2 where the ability to generate high returns on large amounts of capital have turned $100,000 into $3 million and importantly for those desperate for income, turned $3,900 of dividends in 2005 into almost $100,000 of fully franked dividends in 2015.

M2 is not an isolated example of the power of high rates of return on equity and the ability to retain profits. For example, CSL also displayed a less attractive dividend yield than Telstra in 2005, but was able to retain capital and compound it at an attractive rate, ultimately producing more wealth and more income.

Investors chasing the highest yielding blue chip shares are missing out on the returns and income available from true blue chips – the type that we prefer to fill our portfolios with. Investors are making an expensive mistake by eschewing those companies with lower yields today but are able to grow their income. Go for growing income, not the highest yield.


Roger Montgomery is CIO at The Montgomery Fund and author of ‘Value.able – how to value the best stocks and buy them for less than they’re worth.’ As a special Cuffelinks offer for Christmas, go to rogermontgomery.com/valueable-book/ for a two-for-one book promotion until December 13th. The coupon code is TWO4ONE. This article is for general information purposes only.


6 Comments
David
December 12, 2015

Dear Roger,
Is your Table 2 correct? You show the share price as twice the equity at the end of the period. Is not the share price ten times the EPS. So the cash flow would be:
Year 1 -$20.00
Year 2 $0.00
Year 3 $28.80
and the IRR would be 20% as you have shown.

Roger Montgomery
December 09, 2015

Dear Patrick, I was almost certain I had asked the Bloomberg terminal for the split-adjusted data. if not, thank you for picking up the error. The adjusted data only serves to reinforce the argument for pursuing growing income even more.

Patrick
December 09, 2015

True Roger it certainly makes your proposition more powerful. I follow your methodology now due to my age and time left before I think I will retire but seeing this article has changed my thoughts about investing once retired.

I now realise that I should follow your advice even after retiring as it is more likely to provide a better income over the medium and long term.

The link to CSL's announcement to the asx is here --> http://www.csl.com.au/docs/995/712/Share%20split%20notice.pdf

Patrick
December 09, 2015

Good article Roger but I think your calculations are incorrect for CSL. On 18 October 2007 they did a 3 for 1 share split. On 17 October CSL were $100 on 18 October they were $34.

Your calculations severely underestimate the return and value of CSL. They work out to be more attractive than M2.

David Button
December 04, 2015

Roger interesting article ,if only we had the skill or foresight to invest in M2 & CSL at those levels .

David
December 03, 2015

Has roger scaled up for refund of franking credits? Consider the scenario that the initial income from M2 has not been enough and that they may have had to see down some capital which would affect the outcome etc


Leave a Comment:

RELATED ARTICLES

Doubling down on dividends

Dividends: more is less, less is more

Take no income from the best companies

banner

Most viewed in recent weeks

The case for the $3 million super tax

The Government's proposed tax has copped a lot of flack though I think it's a reasonable approach to improve the long-term sustainability of superannuation and the retirement income system. Here’s why.

7 examples of how the new super tax will be calculated

You've no doubt heard about Division 296. These case studies show what people at various levels above the $3 million threshold might need to pay the ATO, with examples ranging from under $500 to more than $35,000.

The revolt against Baby Boomer wealth

The $3m super tax could be put down to the Government needing money and the wealthy being easy targets. It’s deeper than that though and this looks at the factors behind the policy and why more taxes on the wealthy are coming.

Meg on SMSFs: Withdrawing assets ahead of the $3m super tax

The super tax has caused an almighty scuffle, but for SMSFs impacted by the proposed tax, a big question remains: what should they do now? Here are ideas for those wanting to withdraw money from their SMSF.

The super tax and the defined benefits scandal

Australia's superannuation inequities date back to poor decisions made by Parliament two decades ago. If super for the wealthy needs resetting, so too does the defined benefits schemes for our public servants.

Are franking credits hurting Australia’s economy?

Business investment and per capita GDP have languished over the past decade and the Labor Government is conducting inquiries to find out why. Franking credits should be part of the debate about our stalling economy.

Latest Updates

Superannuation

Here's what should replace the $3 million super tax

With Div. 296 looming, is there a smarter way to tax superannuation? This proposes a fairer, income-linked alternative that respects compounding, ensures predictability, and avoids taxing unrealised capital gains. 

Superannuation

Less than 1% of wealthy families will struggle to pay super tax: study

An ANU study has found that families with at least one super balance over $3 million have average wealth exceeding $19 million - suggesting most are well placed to absorb taxes on unrealised capital gains.   

Superannuation

Are SMSFs getting too much of a free ride?

SMSFs have managed to match, or even outperform, larger super funds despite adopting more conservative investment strategies. This looks at how they've done it - and the potential policy implications.  

Property

A developer's take on Australia's housing issues

Stockland’s development chief discusses supply constraints, government initiatives and the impact of Japanese-owned homebuilders on the industry. He also talks of green shoots in a troubled property market.

Economy

Lessons from 100 years of growing US debt

As the US debt ceiling looms, the usual warnings about a potential crash in bond and equity markets have started to appear. Investors can take confidence from history but should keep an eye on two main indicators.

Investment strategies

Investors might be paying too much for familiarity

US mega-cap tech stocks have dominated recent returns - but is familiarity distorting judgement? Like the Monty Hall problem, investing success often comes from switching when it feels hardest to do so.

Latest from Morningstar

A winning investment strategy sitting right under your nose

How does a strategy built around systematically buying-and-holding a basket of the market's biggest losers perform? It turns out pretty well, so why don't more investors do it?

Sponsors

Alliances

© 2025 Morningstar, Inc. All rights reserved.

Disclaimer
The data, research and opinions provided here are for information purposes; are not an offer to buy or sell a security; and are not warranted to be correct, complete or accurate. Morningstar, its affiliates, and third-party content providers are not responsible for any investment decisions, damages or losses resulting from, or related to, the data and analyses or their use. To the extent any content is general advice, it has been prepared for clients of Morningstar Australasia Pty Ltd (ABN: 95 090 665 544, AFSL: 240892), without reference to your financial objectives, situation or needs. For more information refer to our Financial Services Guide. You should consider the advice in light of these matters and if applicable, the relevant Product Disclosure Statement before making any decision to invest. Past performance does not necessarily indicate a financial product’s future performance. To obtain advice tailored to your situation, contact a professional financial adviser. Articles are current as at date of publication.
This website contains information and opinions provided by third parties. Inclusion of this information does not necessarily represent Morningstar’s positions, strategies or opinions and should not be considered an endorsement by Morningstar.