In part 1 of this trilogy we reviewed the work of Harry Markowitz and William Sharpe, whose ideas shape our understanding of diversification, the foundation stone on which modern portfolio theory sits. In part 2, we look at risk in a diversified portfolio, and how well diversification performed in Australia during the Global Financial Crisis.
Diversification and superannuation governance
All Australian superannuation funds must adhere to the investment strategy operating standard embedded within legislation which (in part) states that the trustee of a super fund must:
“….formulate, review regularly and give effect to an investment strategy that has regard to…the risks involved…and the likely returns from…the entity’s investments, [as well as]….the composition of the entity’s investments as a whole, including the extent to which they are diverse or involve exposure of the entity to risks from inadequate diversification.”
The Markowitz/Sharpe language of expected (likely) returns, risk and diversification is explicitly included. As every superannuation trustee is legally obliged to meet the above operating standard, it applies equally to the 300-odd APRA regulated super funds as to some one million individuals who are trustee-members of SMSFs.
A 2007 government-funded financial literacy study found that whilst 55% of people considered potential returns when making financial decisions, only 34% considered risk and return together. More worryingly perhaps, only 5% considered diversification. How therefore should we assess our exposure to “risks from inadequate diversification”?
Diversification by capital and by risk
In the previous article investment diversification was illustrated with reference to a pie chart for the average default APRA-regulated superannuation option. The current average default option holds some 61% in property and equities, 22.5% in cash and fixed interest and 16.5% in alternatives strategies. The chart from Part 1 is reproduced below left.
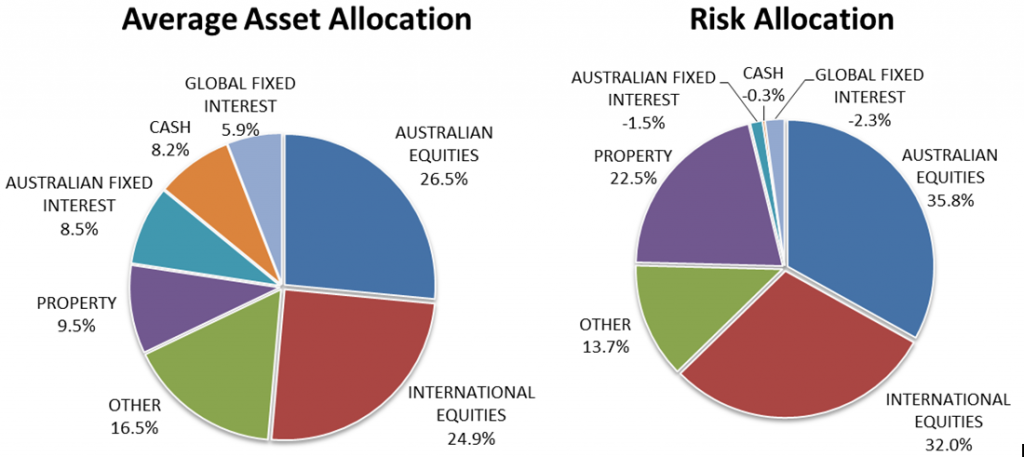
The chart on the right indicates how much each asset class contributes to total portfolio volatility (based on monthly data for the ten years ending December 2013). Australian equities, whilst comprising 26.5% of capital, contribute almost 36% to portfolio volatility. International equities and Australian property likewise add more to portfolio risk than their respective capital allocations. Alternative strategies, taken together, are the only growth-like asset class that contributes less to portfolio volatility than to capital allocation. [Editor’s note: The risk and volatilities contained within the alternatives asset class varies widely depending on what alternatives are used.]
In the average default super option today equities and property account for some 61% of capital, but more than 90% of portfolio volatility. To determine why, one first needs to understand the effect of asset co-movement.
Correlation – the key to diversification
The objective of intelligent diversification is to find investments that do not move together in response to the same stimulus, but will in aggregate provide a satisfactory return. Asset co-movements are generally measured either by covariance or correlation. A correlation coefficient is always bounded by -1.0 and +1.0. Risk is effectively nullified if a portfolio consists of two assets with a correlation of -1.0, similar to sound waves of equal but opposing amplitude. A correlation of +1.0 implies two assets with perfectly synchronous movement, providing no risk reduction benefit at all.
Harry Markowitz’s key insight was that if you could accurately forecast the return and risk of each security in a portfolio and their various correlations, you could create a diversified portfolio optimised between risk and return based on your risk tolerance. In determining what he called ‘relevant beliefs’, Markowitz suggested reviewing historical statistics and adjusting these for “factors or nuances not taken into account by the formal computations”. In other words, the best guess as to what might happen in the future is that which has occurred most frequently in the past, adjusted for any ‘relevant beliefs’ as to future market movements.
Taking the Markowitz approach, the following risk (standard deviation) and correlation statistics compare each asset class with the diversified default option portfolio shown in the above pie chart:
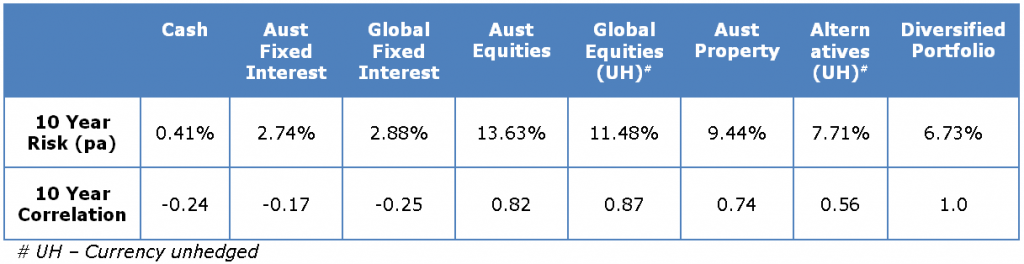
The statistics above reveal why the risk allocation chart differs so markedly from the asset allocation chart. In a portfolio where growth assets dominate, the high volatility of equities and property imposes an outsized influence on total portfolio risk; an influence that low volatility cash and bonds cannot overcome despite the risk dampening effect of their negative correlations.
All the above is wholly consistent with William Sharpe’s pricing model, which holds that higher risk must accompany higher expected returns in order for capital markets to clear. But what of diversification during the GFC? Did it fail when needed most?
Diversification and the GFC
Let’s examine the correlation of Australian equities to other asset classes below:
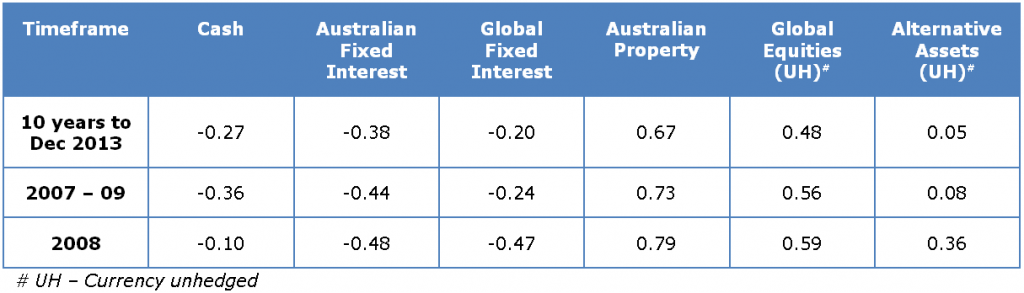
The movement of growth assets did indeed become more synchronous during the GFC. That Australian and global equity correlations increased in the midst of such a downturn should not have surprised. The increased correlation between Australian equities and Australian property was, at the time, less expected and was a result of listed property trusts (A-REITs) having become more equity-like in the years leading up to 2007.
Placing $10,000 in each of the following on 1 January 2008, generating index returns with no contributions, withdrawals, fees or taxes resulted in the following capital value changes by year’s end:
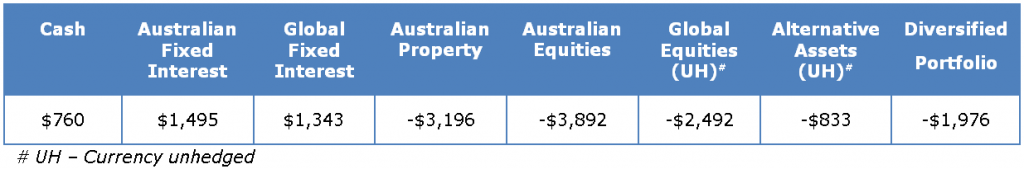
The above data dispels the notion that diversification’s protective qualities disappeared completely during the depths of the GFC. Whilst capital loss was greatest in equities and property, the diversified portfolio’s weighting to these assets was partially offset by strongly positive cash and fixed interest returns, and by lowly-correlated alternative asset strategies that fell only marginally by comparison. Rumours of diversification’s death during the GFC appear to have been greatly exaggerated.
Where to now for diversification?
Diversification works in theory and it appears to hold up in practice. Where it is found wanting is in the assumptions it makes of the average investor’s ability to form ‘relevant beliefs’ as to risk, returns and correlations. Here modern portfolio theory appears somewhat detached from human behavioural reality, as I commented in the Cuffelinks article: The Harry Markowitz Interview, Part 2: Retail financial advice.
The concluding article in this trilogy will incorporate aspects of investor behaviour by considering an alternative approach to diversification in retirement planning.
Harry Chemay is a Certified Investment Management Analyst who consults across both retail and institutional superannuation, focusing on post-retirement outcomes. He has previously practised as a specialist SMSF advisor, and as an investment consultant to APRA-regulated superannuation funds.
The author would like to acknowledge Matthew Drzewucki, Investment Analyst at Equipsuper, for his assistance in the analytical work involved in preparing this article.
The total portfolio volatility analysis was conducted using monthly index returns for the period January 2004 to December 2013. Risk allocation is the historic co-variation between each asset class and the total portfolio, expressed as a percentage of the aggregate variance of the portfolio.
The following indices were used as asset class returns: Australian equities – S&P/ASX 300; Australian property – 50% Mercer/IPD Australia Property Fund Index and 50% S&P/ASX 300 A-REIT; International equities – MSCI World (ex-Aust) net AUD unhedged; Australian fixed interest – UBS Australia composite bond index 0+ years; Global fixed interest – Citigroup world government bond index AUD hedged; Cash – UBS 90 day bank bill index 0+ years; Other – 33.33% Cambridge Associates Australian Private Equity & Venture Capital index, 33.33% MSCI world infrastructure net AUD unhedged, 33.33% HFRI hedge fund composite index gross AUD unhedged.