Register For Our Mailing List

Register to receive our free weekly newsletter including editorials.

Home / 447

Follow the market trajectory and stop the usual mistakes

(Editor's introduction: Peter Thornhill is well-known to many of our readers, mainly for advocating a multi-decade investment strategy based on the long-term merits of industrial companies for income versus nearly every other asset class. For example, to show his consistency, some of his previous articles in Firstlinks are here and here and here. In this new piece, he again checks what he calls his 'mothership' chart, which shows the long-term return from industrial shares versus term deposits. It's his way of arguing that for investors with the right risk capacity and investment horizon, there's only one place to invest).

***

Well, it’s the time of year that I look forward to the most, the new year and the updates to my presentation material. It is also a welcome distraction from the mind-numbing boredom of lockdowns, travel bans, etc.

Below is my ‘Mothership’ comparison of industrial shares compared to cash over 40-odd years. The inevitable reduction in dividends in 2020 no doubt caused some concern but, as far as I’m concerned, it has been ‘same old - same old’. The chart below spells out the reduction in dividends, a slip in share prices and the inevitable recovery of both as life goes on.

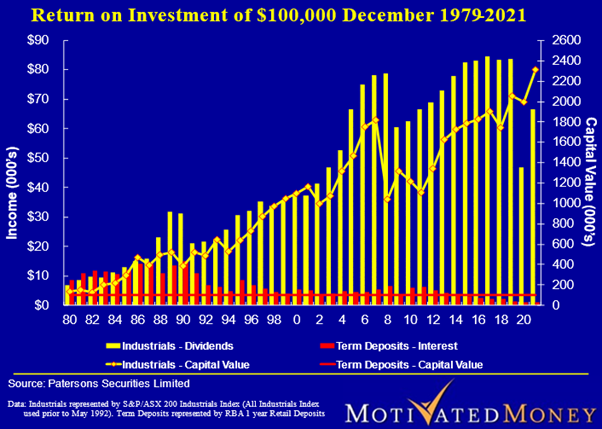
I've always said ... history repeats

Although this chart covers a narrow timeframe, it provides a glimpse of history repeating itself. The 1987 correction stands out clearly and the reduction in dividends is similar in quantum to 2020. This is followed by the dotcom debacle in 2001-02, though whilst share prices fell dividends were not affected as much of the dotcom trash was never going to be dividend paying.

Next came the GFC in 2008-09 when indices halved. Our dividends were less affected as the problem was largely a US invention. I have included below an excerpt from an earlier newsletter as the situation today is eerily reminiscent.

“It will be apparent to most observers that during the last 30 years, any sign of a ‘crack’ in share markets has been met with a barrage of money from central banks. This behaviour became known as the ‘Greenspan Put’. The aim was to ensure that the delicate flower of capitalism known as ‘consumer confidence’ was never allowed to wilt.

As the public and institutions used more and more of this cheap money to fund property and other speculations, the government’s efforts were gradually perverted to ensure that property prices remained propped up; in fact, continued to rise. Rising property prices had become the sole support for consumer confidence and had to be fed at all costs.

This has naturally led to a global bubble in property followed by the inevitable faux handwringing by politicians claiming they are concerned about the housing affordability crisis. The bar to entry for ‘wannabee’ property owners was lowered to ground level; tax breaks were offered to property speculators (negative gearing) and cash incentives were offered by some governments to potential owners. The irony is that ‘dumb policy’ has exacerbated the very problem afflicting their constituents.

The seeds for the current debacle were sown some years ago but naturally no one paid any attention. Allow me to quote from an article written on 30 September 1999 (yes, 1999). Space precludes quoting the whole article.

“In a move that could help increase home ownership rates among minorities and low-income consumers, the Fannie Mae Corporation is easing credit requirements on loans that it will purchase from banks and other lenders. The action which will begin as a pilot program involving 24 banks in 15 markets- including the New York metropolitan region- will encourage those banks to extend home mortgages to those individuals whose credit is generally not good enough to qualify for conventional loans. Fannie Mae officials say they hope to make it a nationwide program by next spring”.

The rest is, as they say, history. Every opportunist opened a mortgage broking centre flogging loans to those who could not afford them and, eventually, some of them committed fraud.

Major Wall Street financial institutions created toxic derivatives and exported them around the world ensuring that the GFC, when it arose was truly global. With a guaranteed buyer of your toxic waste why wouldn’t you?”

Propping up residential property always backfires

I say reminiscent as an article in The Sydney Morning Herald on 12 February 2022 reports on the Government’s desire to help home buyers by taking a stake in the property with the would-be owners. This is in addition to grants, deposits of 2% and ludicrously low interest rates.

Continually throwing money at property is only going to make it worse, not solve the problem.

Anyone who has attended my presentations will be aware of my oft-repeated remark that history shows me that we never learn and just go on repeating the same dumb stunts over and over. The only saving grace is that business continues to flourish as it is core to the aspirations of the human race.

Let’s look at the property sector vs industrials. For newcomers, LPTs (Listed Property Trusts) are now called REITs or Real Estate Investment Trusts. 

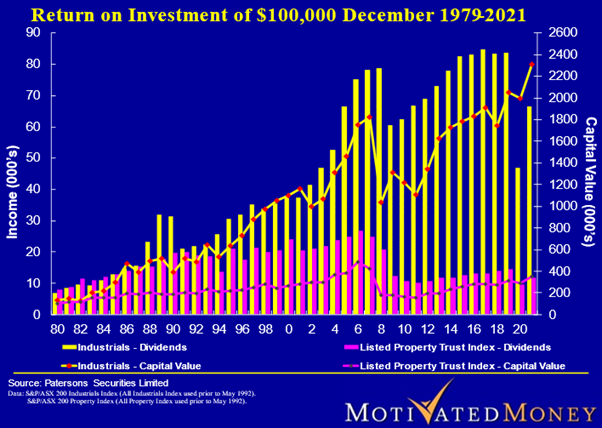
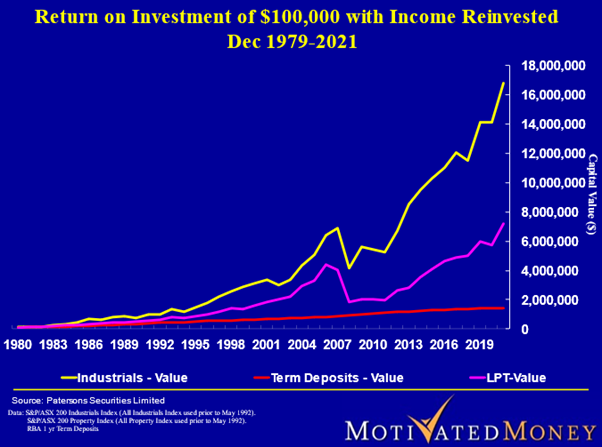
It still gives me pain to listen to the finance industry telling people to invest in ‘balanced’ portfolios to reduce risk. At no stage do they ever tell people the opportunity cost of this. I flatly refuse to add cash and property to my assets to drag the whole thing down, see the chart below.

If only we could provide education to increase financial literacy and enable people to make informed decisions regarding their financial future.

The fear associated with shares is fostered by focussing on volatility. Fear is based on ignorance and if we educate, I am confident that more people will make better quality decisions.

Let's go even further back

I am restricted in what I can demonstrate using Australian shares as the Industrials Index was only established in 1979. To reinforce the value of investing in the backbone of a nation - shares - consider the chart below.

This chart speaks to me: 80 years of US endeavour despite wars, pandemics of HIV aids 2005-12, flu 1968, Asian flu 1956-58 and so on to COVID-19.

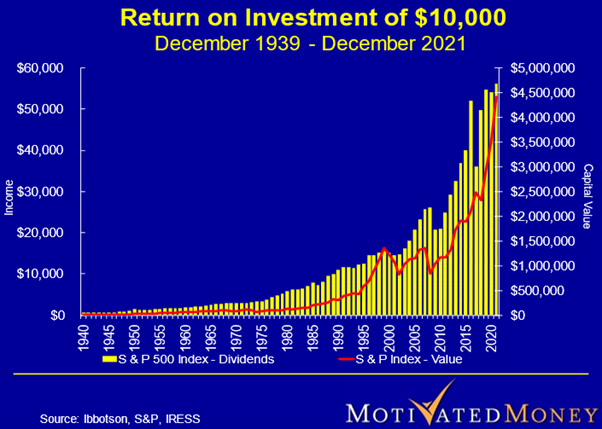
I can reproduce a similar chart for virtually all the developed countries in the world. One example is a listed investment company in the UK that has flourished for over 160 years and has supported many families over that time.

Finally, I will be commencing full day courses again in the vain hope that not everyone is frozen with fear so watch this space. 


Peter Thornhill is a financial commentator, author, public speaker and Principal of Motivated Money. He runs full-day courses explaining his approach to investing "in the vain hope that not everyone is frozen with fear".

This article is general in nature and does not constitute or convey specific or professional advice. Share markets can be volatile in the short term and investors holding a portfolio of shares will need to tolerate short-term losses and focus on a long-term horizon, and consider financial advice.


54 Comments
D Ramsay
March 05, 2022

Great article thanks.
I agree with all that Peter says. However I still hold cash as well.
I think that people forget that "one's risk profile" is not a binary thing.
It is a sliding scale that doesn't reach 100% at either end of the scale - i.e we are all varying mixtures of 2 extremes.
Or ...if you like ..It is a super position of quantum states. The measurement of your state reveals different values as you get older.

Brad
March 01, 2022

Looking at the first chart, it's interesting to see quite a large gap between the capital value and dividends paid opening up over the last 24 months.

SMSF Trustee
March 02, 2022

Brad, dividends got whacked by COVID as companies- especially financials - had to focus on capital management. They're starting to be rebuilt now and the gap will close.

CC
March 01, 2022

Peter,
City of London investment trust has British American Tobacco as it's number one holding !!!
Reprehensible in this day and age.
I don't care how good it's dividend record is over the past 160 years.

SMSF Trustee
March 02, 2022

CC, fair enough point but wrong time and place to make it, I think. Irrelevant in a discussion about broad asset allocation, not specific stocks.

Phil
February 27, 2022

Hi Peter, when you say you refuse to add cash to your portfolio of assets, say in a year where on the chart dividends fell to 40K from 80K or other periods similar, if you have a lifestyle income expectation built on much higher years, how do you survive on half your income if you have no cash? We can also see dividends in absolute dollars not reaching the levels as before for 5 years post GFC, or tech booms etc - so without cash and higher income need ( or in a super fund a higher aged based minimum requirement) then you must be reducing lifestyle significantly ( which sounds like bad planning to me) or selling Shares at low prices to support income ( which also sounds like bad planning) and if you were doing the latter, the growth in the portfolio would not look like the Chart.

Bluey
March 02, 2022

I do too. The reasons are, I’m not in retirement yet, so income is still coming in from work. And two, the dividend yield is now four times more than income required in retirement (therefore a cut would not be a problem). This 100% equities only strategy, while admittedly not realistic for everyone, has worked, where earnings from a well paid stable job have been invested for 20yrs into ASX’s top profitable companies, with selective reinvestment of dividends, no fees bar brokerage, primarily due to compounding. I think it was at the ASX in Bridge St in 2000 when I first heard Peter lecture. There is now a sweet spot where dividends can be targeted without worrying about the share price because the capital will probably never need to be realised, unless the company loses its way. (And it’s not hard to spot an AMP, by the way SMSFTrustee.) Additionally, the succession planning for a surviving partner is likely to be easy, just carry on spending the dividends.

Peter Thornhill
March 02, 2022

Hi Phil.
I do not have a cash 'investment'. In our super fund we hold two years mandated minimum withdrawals in the event there is a total disaster. We haven't had to draw on this as, being old, we adjust our lifestyle to our income.
Just like our parents did and their parents before them. We have not had to reduce our lifestyle because of reduced dividends as we were never able to spend them all in the first place but have reinvested the excess which means our super fund is now twice the size it was when we retired in 2007. I fail to see that this could be classified as "bad planning". Finally, as a result of the above, the growth in our portfolio looks just like the chart!

Chris Davis
February 01, 2024

Hello Peter, I realize this is an old article, but I seek clarification.
You say you have no cash investment in your super, but you hold 2 yrs of minimum withdrawals in case of disaster.
Could you explain how you hold this two yrs of cash? Is it sitting in your super fund just as cash, but not being drawn as part of the minimum withdrawal mandate.
I ask this question as I am soon to convert my super accumulation account to pension account, and I would like to have a minimum of two yrs expenses sitting within the fund waiting for a disaster.

Phil
February 27, 2022

Hi Peter, have you ever calculated the '' lost' benefit of no CGT discount in the LIC structure? I'm just interested if anyone has ever quantified it, it must be somewhat meaningful?

Peter Thornhill
March 02, 2022

I am grateful to a LIC CEO for a response to your 'assumed' lost CGT benefit.

There are a few angles on this, however in broad terms the concept of “losing the CGT discount in a LIC” is not technically correct. The tax system has been designed so that the tax regime applies similarly across all investment structures.

LIC’s generating gains on capital account that are eligible for the CGT discount do pass the discount benefit onto shareholders via LIC CGT Discount Dividends (basically dividends that carry the benefit of the discount). ie There is no lost discount in this circumstance.

LIC’s, managed funds or ETFs generating gains on revenue account, or <12 month capital gains, aren’t entitled to the CGT discount, just the same as individual investors aren’t entitled to the CGT discount on revenue account or <12 month gains. ie There is no difference here either whether you are a LIC, ETF, a managed fund or individual. Indeed the majority of professional investment funds are highly active and are not eligible for the CGT discount on many of their gains.

On the general question of whether any investor is better to hold an investment on capital account for > 12 months and thus obtain the CGT discount – the answer is simple - yes – all other factors being equal. The maths are easy – it’s a 50% tax saving. No other calculation is needed.

The further consideration in C. above is that all other factors aren’t necessarily equal all the time:

There are specific investment strategies that require shorter term holding periods that may not be eligible for the discount. In these circumstance the investor hopes to generate a sufficient benefit from the other elements of strategy to offset the tax differential.

In some instances investors may have to consider selling an asset within 12 months of purchase. The outlook may have changed rapidly. It may be that its financially better to sell than hold the investment for longer to obtain the CGT discount.

Phil
March 08, 2022

Thanks, I can't say I've heard of and LIC CGT discount 'dividend'. It seems to be saying I can pay higher dividends than normal, if the discount didn't apply, because it passes through the capital account? And yet the ATO seems pretty clear that Companies can't apply a CGT discount, so I'll have to do more tax research.

Steve
February 24, 2022

Thanks again Peter. I attended one of your seminars about 10 years ago and it was a definite 'lightbulb' moment. The "safety" of cash is even poorer now and can't even offer short term competition with dividends. Opportunity cost has never been so obvious. One issue I have with your approach however is the emphasis on dividend paying (preferably franked?) companies. Of course not having to sell down assets to supplement income is ideal but outside Australia many companies pay quite low dividends (closer to 1%). Given the very concentrated nature of the ASX and the proven prudence of diversification (companies/geographies/sectors) could you perhaps rejig your plots around a "total return" investment approach (say the World MSCI Index?) with say a 5% annual withdrawal as the source of income. I'm sure the outcome would be similar but it would be good to show how such an approach can work. I wouldn't be surprised if technology disrupts the rivers of gold our banks currently deliver (I chose that phrase deliberately due to its historic use for newspapers and their classified's income and we all saw what technology did to them!) or if China finds a way to diversify its iron ore purchases eventually. Our market has some quite specific risks is all I'm saying.....One caveat of a total return approach (which usually means less emphasis on dividends) is the value of having some cash as a buffer so that in a market downturn you can avoid selling assets (which a total return investment requires if dividends are less than income needs) in a short term downturn. 10% in cash is a 2 year buffer for a 5% income target ( a bit longer actually as some dividends would still supplement the 5% income target).

Nick
February 24, 2022

Supporting the comments from Peter and Kevin, a 2 bedroom apartment in South Perth could be purchased for about $175,000 (1997) and sells for about $350,000-$360,000 today. That is roughly 3%pa growth (inflation?). If the $175,000 was used to buy CBA shares in 1993 (2nd public offering, $9.35 per share, let's say $10), the value of your holdings at $100 per share would be a staggering $12.2M or $9.8M at $80 per share. That is is a huge opportunity cost. If the $175,000 was invested in an Australian Share Index fund in 1997, in late 2021 it would have been worth about $1.4M. This is still a significant opportunity cost. Wishing I had known better in 1997.

CC
February 24, 2022

Well South Perth may be an exception.
I too bought a place in an inner Melbourne suburb in the late 90s for approx $190K but it is now valued at close to $1M. Plus over 20 yrs of rental income. You wouldn't get a broom closet for $350k here nowadays.
You can get a bank to lend you lots of money to buy a property but probably not for buying shares.
Both can be great investments.

Alex
February 24, 2022

How does the 20 years of rental income compare to corporate dividends (which come with franking credits) though? And what's the actual return of the inner Melbourne suburb once you take into account financing costs and other costs associated with owning a property? Agree both shares and property can be great investments, but fundamentally properties are not productive assets - its price is pretty much driven by demand and supply which are affected by various external factors (e.g. interest rate, population, etc.) not related to the intrinsic value of the asset itself. The fact banks are willing to lend money for property doesn't necessarily mean it's superior to shares.

Michael
February 24, 2022

Even great property that has experienced capital growth doesn't allow you to plough the dividends / rental income back in as extra bricks to get the full benefit of compounding. That's where the magic really is. Although I would agree that banks allow a high degree of leverage for property. Maybe if you use property as a way of establishing significant borrowings early in life, then use surplus cash flow to build up a share portfolio with reinvested dividends you can enjoy the best of both worlds.

Reeferdog
February 28, 2022

But if you used the repayment amounts the same as in your inner Melbourne place say $190k because you are correct not easy to borrow for shares just need some discipline and the right temperament.
$19K deposit
$171K loan at around 6.5%
$1175 per repayment over 25 years
so we buy $19K worth at the Nov 93 and buy $1175.00 every month for the next 25 years result would be.
CBA $4.5m and last annual dividend of just under $190K
or
WES $6.8m and last annual dividend of just under $424K

ggg
March 01, 2022

but you use leverage in the house purchase, where hard to leverage stocks to the same amount with the Vol. its not a like for like example.

Peter Thornhill
March 02, 2022

The problem ggg is that banks are run by Australians. Living in an apartment because long term leaseholds do not exist in this country enables me to use the value of the property to gear into shares. Mind you, it took some talking to finally get the bank to understand why they couldn't charge me more buying 'risky' shares as opposed to an investment property. Now borrow huge amounts at 2.4% fully tax deductible to enhance our non super portfolios. Dividends alone from the portfolios are 5 times greater than the interest. That is without taking into account the tax deduction for the interest and the franking credits on the dividends. The bank is paying me to borrow money from them. Gotta love it.

Linda
March 02, 2022

Property is very expensive to own.When someone says says " I bought this house for $X and sold it for $XXX". they forget all the expenses involved - lawyer, stamp duty, loan interest, council rates, insurances, maintenance, possible tenant defaults and damage, estate agent handling fees and land tax. My brother in 1999 had 2 rental properties in Sydney and a block of land in the Blue Mountains and his yearly Land Tax was $2000 . Today on one rental property the Land Tax is $10,500.The rent now hardly pays or the on-going expenses.

Mr Pennybags
February 24, 2022

Thanks Peter.

I've been following you for a while now.
K.I.S.S - buy LICs and UK Investment Trusts at good prices. Collect the dividends and buy more of the same. Punt on a few single stocks for a bit of fun and maybe a chance to make a ten bagger. Good enough for me.

Antoine
February 23, 2022

Thanks Peter
I agree. A similar philosophy has worked well for me for the last 30 years.
Suggestions:
It's time to retire when the dividends more than cover living expenses. Then the growth in dividends means it's highly unlikely any shares will have to be sold to provide cash. Thus the volatility in the market becomes meaningless. End of worries.
In 1993 I constructed a portfolio to mimic the All Ords by buying the dozen largest companies, weighted by market cap. It followed the index close enough for years - with no fees, taxes or any middlemen. 29 years later, I still haven't found any individual who has done that, and hardly anyone who understands how and why. It's not that hard to match the index which outperforms nearly all super funds nearly every year (after fees and taxes.)

Bob
February 23, 2022

Gee what happens when you need to start withdrawing funds at retirement? What if you retired in 2007? One minute you have enough money and the next not enough. If it's so good, shouldn't we gear up a storm too?

Mart
February 27, 2022

Hi Bob - a couple of thoughts in response to your very valid 'what happens?' question ... the first is that if you can hold your nerve (and some obviously can't) you don't care too much about share prices if you never sell and it's the dividends that you need to live off that you do care about. And they remain reasonably consistent (albeit with reductions in tough times). All you are really doing is swapping reinvestment of dividends for consumption of dividends when you get to retirement age. The second is to ask what strategy you'd find comfortable if you don't agree with this one (even at 2007) ? I doubt selling down good dividend producing assets in a slump is a good idea ? Wouldn't it be best to ride out the storm / belt tighten and stick with retaining good assets that pay reasonable dividends ? if there is a 'better' strategy then I'd love to understand it

A
February 23, 2022

Thanks Peter

Great charts again highlight the importance of "long term" - for me its the lifecycle of my yet to arrive grandkids and charities we want to support , so its 100 years.

Anecdotally , your strategy seems to work as our passive income is now way beyond our wildest imagination

ken
February 23, 2022

KP
Peter i have followed on from a conversation i had with you approx 25 +/- years ago after you gave a talk on investments while you were with MLC and we thank you wholeheartedly for a financial secure retirement. I am about to hit 80 and starting to get the wobbles. Is there an ETF i could now utilise ???
I have purchased your latest book and gave a copy to each of my children and grandchildren.
once again a very big thank you .

Dave Roberts
February 23, 2022

Is there an ETF designed to follow just industrials in Australia? VAS and A200 include resources and REITs. Seems like a good opportunity.

Peter Thornhill
February 23, 2022

Dave, try Whitefield (WHF) a listed investment company (LIC) that's been around for 98 years and is 100% industrials.
As a LIC, it doesn't have the problems ETF's and other managed funds with a trust structure suffer. Refer to some of my previous articles on this issue - "My Say" on my website. Contributor "C" has chosen Japan as a negative example I'll match him with a UK LIC I use which has been around for over 160 years and has just celebrated 55 years of consecutive dividend increases. It's called compounding.

CC
February 23, 2022

Peter, WHF does have REITs, currently about 9% of it's portfolio.
Goodman is it's 9th largest holding.
however, Goodman is 27% of the REIT index and has been a spectacular performer in the last 13 years since the GFC so it's not a bad thing to hold.

Kevin
February 23, 2022

Peter people look for validation,not reality.To most people the name of a company that went bust proves that every company in the world will go bust.An index that did nothing proves every index did nothing.Facts don't fit in with what they want to see so the facts are wrong.
Probably they have never bought an index or a share in their lives,but happily say ask the guy that bought at the top,which was basically nobody.
Why doesn't everybody gear up to the hilt is a common cry,you don't need to.
$10K into AXJOA was a lot of money in 1980.Reality is 42 years later it is nothing,perhaps 1% of income earned over that period.
With a can do attitude paying back $10K is easy.Borrowing say $25K in 1995 thinking this works well this compounding thing,and paying it back,easy.Never happens,all the excuses in the world to avoid it and deny it.

$10K into CBA got you 1500 shares in 1991 or 1992.Leave them alone to compound and use the DRP.That proves nothing at all and it never will.Around $1 million now for a 10K outlay.Taking care of your financial destiny is a luxury.Private schools,new cars,holidays etc,these are vital needs.
I find it pitiful that after 3 decades of rise,fall,rise the neverending volatility ,CBA has 19,480 with between 5,000 and 10,000 shares directly .
For the next 3 decades it will be,don't buy shares in CBA,look what happened to the Japanese market,ask 'some' people what they think,ask 'everybody else'why they didn't do that,how could they all be wrong.There is no end to it from birth to death.

The $100K was a bit much though,I could've bought 3 or 4 houses in Perth for that much then.I would call fault on that,the rest is correct without using charts or anything I lived through it,and was investing most of that time.

Mark
February 23, 2022

According to the link (if I read it correctly), the purchasing power of $10,000 in 1939 was worth about $450K in 2021 dollars...about 10 times.

Your return on investment chart of $10,000 in 1939 shows about $4.5 m in 2021 dollars...only about 10 times increase in actual purchasing power.

But it looks more impressive when expressed as on the chart! But, I have no quibble. :)

https://www.in2013dollars.com/australia/inflation/1939?endYear=2021&amount=10000

Kevin
February 23, 2022

I forgot to add that in the previous post. AXJOA is the accumulation index.I think it started on 1/1/80 at $1000,now at approx $84,000,good growth.Take off 25- 30% for fees over 42 years and it is still good growth.You get a rough idea.

$100 K in 1980 was approx 10 years average wages,well out of reach of everyone.The equivalent of spending around $900K today.Spending $10K then is the equivalent of spending $90K today,it isn't going to happen.
When I started work in the 1960s tradesman wage was $40 a week.I wouldn't be concerned about overthinking it.$2K compounds to around $500 K @10% now.You can have the $500k by spending $2K,or spend the last 53 ish years looking for reasons not to do that

CC
February 23, 2022

people earned a bit more than 10K per annum in 1980.
the average male was earning $268 per week or approx $14K per annum
https://www.ausstats.abs.gov.au/ausstats/free.nsf/0/33D35E5114E5ECFFCA25750C001399DE/$File/63020_SEP1980.pdf
so $100K back then was about 7 years average wages.
but obviously high income earners, who also invest more than the average person, earn a lot more than the average !

mark
February 23, 2022

although i agree with your ideas we gloss over the fact that if you investwd 100k just prior to the crash its a different story

Kevin
February 23, 2022

That's emotions Mark The story is exactly the same.I pick individual companies.Time is money.
If you bought CBA right at the top in 2007 then they were $62 each.You bought 1500 shares roughly for $100K.Tick the box to use the DRP,.You now have 3000 to 3500 shares at whatever they are today.Where is the problem?. You have around $300K or over of CBA shares

There aren't a wide variety of what ifs.The story starts the day you buy the shares,the story ends the day you die and leave them to family/charity or whatever you choose.Or you panic and sell them if the price falls.
You buy shares today and the future is exactly the same,the crash might be starting now,it might not.There will be a crash in the future.Looking at share prices every day and paying attention to all the noise probably would frighten people.
Not listening to the noise and looking at prices once a year they are reasonably stable,and rising.
Take a run of the mill day,say 1/1/2000.Look at a chart from then 'til now and dividends reinvested.Look again on 1/1/2040,the growth will be amazing.

US companies are very good for information,stock splits etc.I think Australian companies need to catch up in this department.
Coca Cola $40 on issue,1919.You do nothing and stock splits now mean you have around 9300 shares @ $60 each approx.
Wal mart a 100 share purchase in 1970 or 71 cost $1760.After 11 two for one stock splits you now have around 204,000 shares @ $140 each. Or you can spend a lifetime saying,yeah but what if.Everybody has the same choice

C
February 23, 2022

Hi Kevin, "The story starts the day you buy the shares, the story ends the day you die" - even if you take out the emotion this is a luxury most people can't afford. Most people need to cash out at some stage, to buy a home, pay for private school fees or even pay for living expenses due to unemployment and etc. Please check out my comments below and tell me you wouldn't be depressed if you were that guy who invested in Nikkei 225 in 1990 :-)

John
February 23, 2022

I find it interesting that in all advertisements for financial investments there is the comment "Past performance is not a reliable indicator of Future performance" but here, Peter writes "it provides a glimpse of history repeating itself" Why is it that the government continues to make investment houses tell us "Past performance is not a reliable indicator of Future performance" when in all other matters of life, we look at history as a predictor of the future. Consider why I am not part of the Australian cricket team. I have a history of averaging about two in the under 10s, whereas Steve Smith has an average of over 50 in Test Cricket. Surely, if "Past performance is not a reliable indicator of Future performance" I should be playing for Australia? Why is it at a job interview, we ask prospective employees about their past performance? After all, the government tells us "Past performance is not a reliable indicator of Future performance"

Graham Hand
February 23, 2022

Hi John, spot on. In this article https://www.firstlinks.com.au/my-10-biggest-investment-management-lessons, Chris Cuffe says: "Past performance is the best guide to future success."

James
February 23, 2022

"Past performance is not a reliable indicator of Future performance"

It's merely a legal disclaimer! Common sense dictates that, barring a key person change or investment style change, past performance is all you can judge on. As always words are meaningless, actions (results) speak the truth!

Graeme B
February 25, 2022

Yeah, this reminds me of the old(?) adage... Remember that the future is made in the past, so be very careful what you do in the past!!

SFF
March 05, 2022

Another variation "Past behaviour is the best predictor of future behaviour"

michael
February 23, 2022

Best comparative charts ever. Thanks.

John
February 23, 2022

I first saw these graphs about 15 years ago when I was still practicing Financial Planning.

I managed to get the data behind the graphs, and did some modifications. We all know that clients panic when they see their account balances fall, and in spite of all us telling them to look at the long term, clients will only look at the short term.

I decided to redirect their short term focus, and that was onto the income produced by their investment, rather than their investment balance. I then told them that what they wanted was for this year's income to be higher than last years. Then produced a graph to show them the percentage change in come from last year to this year from cash (interest) and from the share market (dividends). And then worked out how frequent this year's interest was higher than last year and how frequent this year's dividends were higher than last year's. Have a look at the first and second graphs (the bars not the lines) and you will see that almost always this years dividends are higher than last year's (yellow bars) but the same is not always so with the pink bars or the red bars. there are rare exceptions, for example in 1990 and 2008 (but look at the increases in the years leading up to those years)
If this year's income is higher than last year's then you should have enough money to live on

C
February 23, 2022

Wow the 3rd chart is really impressive - if someone had bought $100k industrials shares 1979 and reinvested all dividends, his portfolio would be worth $17m in 2021???!!! I hope industrials shares refer to a broad based index such as XNJ? If investors had to pick stocks then this chart wouldn't be as convincing.

David
February 23, 2022

C - Industrials is "all ASX 200 companies, ex-resource stocks" (so is actually XJI as the broad index (XJO is S&P/ASX 200, XJR is resources companies in that index, and XJI industrials) - XNJ is only about 20 stocks within the much more granular GICS 'industrials' classification).

(And, don't forget, they would have received healthy franking credits too!)

C
February 23, 2022

Thanks David. That's right, the franking credit.

Can someone tell me how to interpret the first chart? The portfolio would be worth $2.3m in 2021 if one had invested $100k in 1979 without reinvesting the dividends. Not sure how to interpret the dividends.

Peter Thornhill
February 23, 2022

The chart shows the value of the portfolio and the bars show the dividends you would have received as cash in your hand; plus franking credits.

C
February 23, 2022

Thank you very much Peter. Your article is an eye opener. Can I please clarify the following?
1) Comparing chart 1 and chart 3, the difference in portfolio value of $14.7m ($17m - $2.3m) can be explained by dividend reinvestment? That sounds a lot!
2) For chart 1, the yellow bars are dividends and franking credit received each year? For example, for 2021, while the portfolio value is $2.3m, the value of dividends is >$1.9m ( cash + franking credits). Sounds a lot!

Separately, I think Mark has a good point. If someone had invested in Nikkei 225 in 1990 just before the crash, the value of his portfolio would still have 25% capital loss today (31 years later) although he might have received some dividends. 30 years is a long time. If this guy started investing in japan at 22, he would still be staring at loss at 52 years old and that would be most depressing.

Peter Thornhill
February 23, 2022

C, The dividends in chart 1 are the actual cash paid without the franking credits. You seem incredulous at the difference between chart 1 and 3!! I have shares that I've held for 20 years where the dividends, which have NOT been reinvested now total more than TWICE my original investment and the share price has skyrocketed. If I had reinvested them the total return would leave you gasping. However, your pessimism seems pretty ingrained so perhaps the share market is not for you.

James V
February 24, 2022

Just to clarify a point in C's second question, the legend for dividends is on the left of the chart. So the value of dividends is about $65k, not $1.9m

Kevin
February 27, 2022

C
Peter is right,compounding is easy You need the ability to multiply a number by 2.
Call it CBA,all industrials,Vanguard fund or Fred Flintstone,it doesn't matter .
CBA started at $6 in 1990.Round numbers.
6. 12. 24. 48. 96. They are around $96 now.Fred Flintstone was born 6 kilos,he got old and fat now 96 kilos.

You bought 1000 shares ( or an index ,LIC,ETF) that cost $6000.
Multiply it by 2
1. 2. 4. 8 that is the dividends reinvested.You double your shareholding over a period of time,you have 8000 shares.A miracle occurs,it is now 2030,CBA doubled again you have 8000 shares @ $192 each.
The board of directors didn't manage to run their own noses for the next 8 years ,CBA only went up to $100 by 2030 you have 8000 shares at $100 each,are you happy?
Would you prefer to do that or spend 50 years saying,Japanese index,some people on and on.
The big tip is,probably 99% of people will deny that the 2x table is real.

Kevin
February 27, 2022

To add further ,it all depends on what you want to see.
Jeff Bezos is worth $150 billion ,50 million shares in Amazon @$3000 each.Let's call it $200 billion,make the numbers easy.For at least 99% of people this would be
Lack of diversification.
Concentration risk.
No $ cost averaging
Sequencing risk.
How come everybody else didn't do that.
Some people would say/think.
On and On and On.
Amazon crashes,share price halves,Jeff goes from being worth $200 billion to being worth $100 billion.
Has he made a $100 billion and everything is great.Or has he lost $100 billion,this is a disaster.
Losing $100 billion proves diversification,concentration risk,sequencing risk etc they are all very wise.Then to top it off the Japanese index is the icing on the cake to really prove,look what happened there.

Or has he made $100 billion,concentration risk,Japanese index,all complete rubbish.
What do you want to see?
If you can think of the name of a company that went bust that proves Amazon is going bust.
Amazon didn't go bust,does that prove the other company didn't go bust.
Both statements are wise,or both statements are rubbish?

AlanB
February 23, 2022

Thank you Peter. I still follow your dividend focused strategy for the reasons you articulated so forcefully on the course I attended. Peter once said he hoped there would be another GFC type plunge for the buying opportunities it presented, which happened in February - March 2020 and allowed us all to pick up some juicy bargains. Also, I remember him saying that if you want to know the future, take the 'mothership' chart and project it 50 years ahead because all the ups and downs will repeat but the trend is ever upwards.


Leave a Comment:

RELATED ARTICLES

The data doesn't lie: dividends on Resources versus Industrials

The best strategy to build income for life

The familiar story on dividends, plus predictions for 2023

banner

Most viewed in recent weeks

2024/25 super thresholds – key changes and implications

The ATO has released all the superannuation rates and thresholds that will apply from 1 July 2024. Here's what’s changing and what’s not, and some key considerations and opportunities in the lead up to 30 June and beyond.

The greatest investor you’ve never heard of

Jim Simons has achieved breathtaking returns of 62% p.a. over 33 years, a track record like no other, yet he remains little known to the public. Here’s how he’s done it, and the lessons that can be applied to our own investing.

Five months on from cancer diagnosis

Life has radically shifted with my brain cancer, and I don’t know if it will ever be the same again. After decades of writing and a dozen years with Firstlinks, I still want to contribute, but exactly how and when I do that is unclear.

Is Australia ready for its population growth over the next decade?

Australia will have 3.7 million more people in a decade's time, though the growth won't be evenly distributed. Over 85s will see the fastest growth, while the number of younger people will barely rise. 

Welcome to Firstlinks Edition 552 with weekend update

Being rich is having a high-paying job and accumulating fancy houses and cars, while being wealthy is owning assets that provide passive income, as well as freedom and flexibility. Knowing the difference can reframe your life.

  • 21 March 2024

Why LICs may be close to bottoming

Investor disgust, consolidation, de-listings, price discounts, activist investors entering - it’s what typically happens at business cycle troughs, and it’s happening to LICs now. That may present a potential opportunity.

Latest Updates

Shares

20 US stocks to buy and hold forever

Recently, I compiled a list of ASX stocks that you could buy and hold forever. Here’s a follow-up list of US stocks that you could own indefinitely, including well-known names like Microsoft, as well as lesser-known gems.

The public servants demanding $3m super tax exemption

The $3 million super tax will capture retired, and soon to retire, public servants and politicians who are members of defined benefit superannuation schemes. Lobbying efforts for exemptions to the tax are intensifying.

Property

Baby Boomer housing needs

Baby boomers will account for a third of population growth between 2024 and 2029, making this generation the biggest age-related growth sector over this period. They will shape the housing market with their unique preferences.

SMSF strategies

Meg on SMSFs: When the first member of a couple dies

The surviving spouse has a lot to think about when a member of an SMSF dies. While it pays to understand the options quickly, often they’re best served by moving a little more slowly before making final decisions.

Shares

Small caps are compelling but not for the reasons you might think...

Your author prematurely advocated investing in small caps almost 12 months ago. Since then, the investment landscape has changed, and there are even more reasons to believe small caps are likely to outperform going forward.

Taxation

The mixed fortunes of tax reform in Australia, part 2

Since Federation, reforms to our tax system have proven difficult. Yet they're too important to leave in the too-hard basket, and here's a look at the key ingredients that make a tax reform exercise work, or not.

Investment strategies

8 ways that AI will impact how we invest

AI is affecting ever expanding fields of human activity, and the way we invest is no exception. Here's how investors, advisors and investment managers can better prepare to manage the opportunities and risks that come with AI.

Sponsors

Alliances

© 2024 Morningstar, Inc. All rights reserved.

Disclaimer
The data, research and opinions provided here are for information purposes; are not an offer to buy or sell a security; and are not warranted to be correct, complete or accurate. Morningstar, its affiliates, and third-party content providers are not responsible for any investment decisions, damages or losses resulting from, or related to, the data and analyses or their use. To the extent any content is general advice, it has been prepared for clients of Morningstar Australasia Pty Ltd (ABN: 95 090 665 544, AFSL: 240892), without reference to your financial objectives, situation or needs. For more information refer to our Financial Services Guide. You should consider the advice in light of these matters and if applicable, the relevant Product Disclosure Statement before making any decision to invest. Past performance does not necessarily indicate a financial product’s future performance. To obtain advice tailored to your situation, contact a professional financial adviser. Articles are current as at date of publication.
This website contains information and opinions provided by third parties. Inclusion of this information does not necessarily represent Morningstar’s positions, strategies or opinions and should not be considered an endorsement by Morningstar.