Register For Our Mailing List

Register to receive our free weekly newsletter including editorials.

Home / 47

Global stock markets in 2013

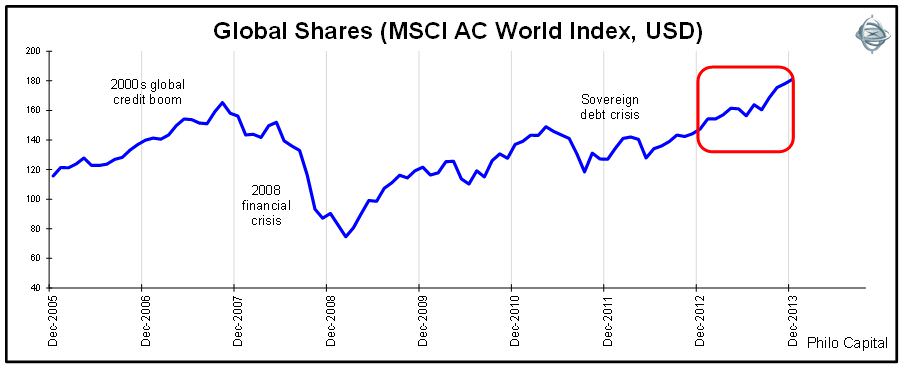
In 2013 stock markets around the world continued their rebound that began in late 2011 and early 2012, following the 2011 dip that was triggered by the European banking and debt crisis and the US credit downgrade. In 2013 the only minor dips for global stock markets were the Cyprus bank bailout crisis in March and the QE taper scare in May-June.

Our first chart shows the global total return index (including dividends) in US dollars since 2005:

The following charts show broad stock market indexes for the main global markets for 2012 and 2013:

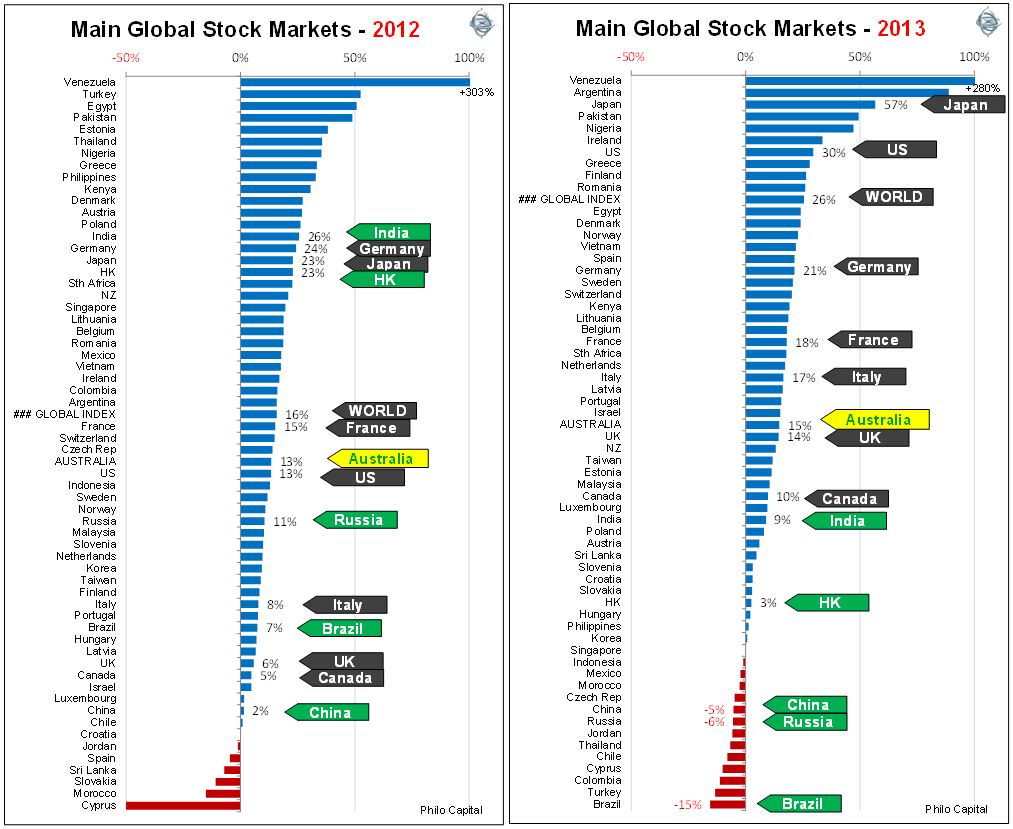
In 2011 earnings and dividends were up in most countries but stock market indexes were down almost everywhere.

In 2012 earnings were down in most markets and dividends were flat or down in most markets, but market indexes were up almost everywhere.

In 2013 almost all developed markets were up, although earnings were weak and their economies were still on life support in intensive care wards, supported by extremely loose fiscal and monetary policies. Meanwhile, the far more fiscally sound and faster growing large emerging markets were suffering the effects of domestic slowdowns, rising inflation and poor equity returns.

Developed Markets

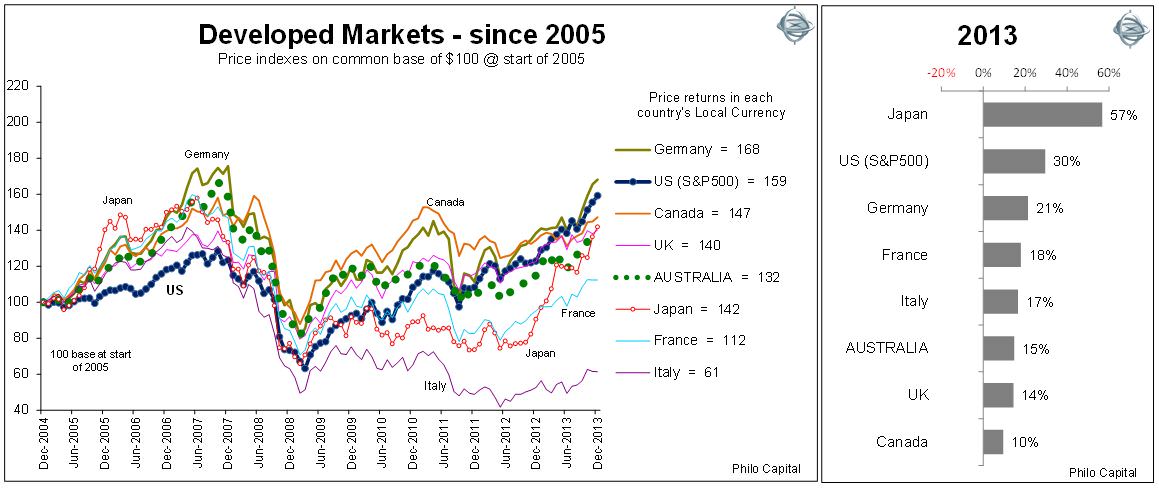
The 2012-2013 rally was led by the big industrial giants - US, Japan and Germany - driven in each market by cyclical companies such as industrials, retailers, media and banks.

European markets showed a pronounced divergence between the so-called ‘industrious’ north and the so-called ‘profligate’ south.

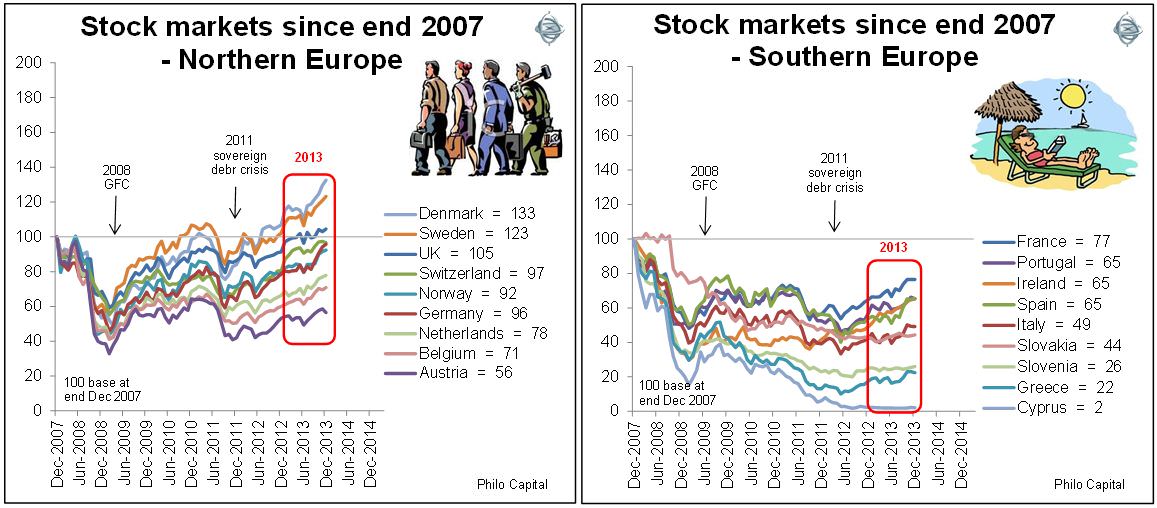
Despite this divergence, virtually all European markets rebounded strongly in 2013 (apart from Cyprus and Slovenia with their banking crises). Even Greece has rebounded strongly since its first and second bailout, as it heads for yet another bailout.

Emerging Markets

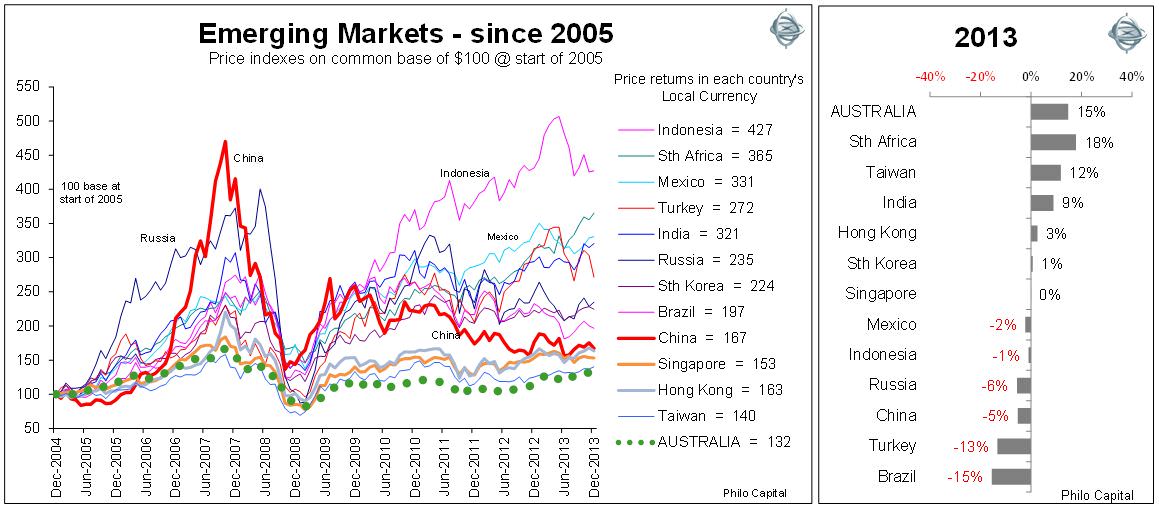
(Note the vertical scales on the charts for developed markets and emerging markets are very different in order to show the much larger swings in the emerging markets. All emerging markets except Taiwan have outperformed the developed markets and Australia by big margins through the pre-GFC boom, through the GFC itself, and in the post-GFC recovery.)

The worst of the main emerging markets have generated similar returns to the best of the main developed markets over the period, so if all markets were shown on the same chart, all of the emerging markets (aside from Taiwan) would appear above the best of the developed markets.

Emerging markets have been much more volatile and have been very vulnerable to the ‘hot money’ effect as money rushes in and out of global markets in ‘risk on/risk off’ swings. We saw this in the capital flight in the wake of the May-June 2013 Bernanke QE scare, and again in December as the QE taper plan was finally announced.

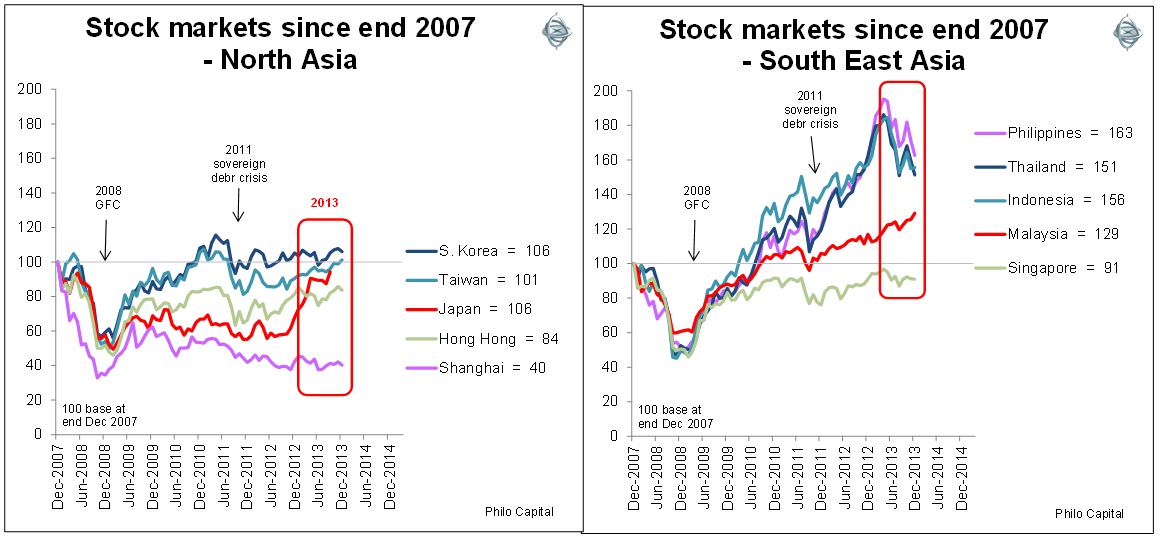
The south-eastern Asian markets were hit hard in the global capital flight due to the QE taper scare but most are far better placed now than they were when the 1997 Asian currency crisis hit.

As in Europe, there is a diversion between north Asian markets (driven largely by China) and South-East Asian markets (which are less reliant on the China supply chain). This is very evident in the following pair of charts:

In 2013, as in the past few years, the BRICs (Brazil, Russia, India and China) were the laggards, with their slowing economies, inflation problems and highly concentrated stock markets dominated by state-controlled enterprises.

The term ‘BRIC’ was a brilliant marketing gimmick invented by Goldman Sachs ten years ago to sell stocks and consulting services. However the BRIC markets have generally been a disaster for investors. As investors, we see the BRIC phenomenon more in line with the J P Morgan term: ‘BRIC: Bloody Ridiculous Investment Concept’.

Our consistent advice for investors over the past several years has been: “The further away from China you are the better”.


Ashley Owen is Joint Chief Executive Officer of Philo Capital Advisers and a director and adviser to the Third Link Growth Fund.


  •   31 January 2014
  •      
  •   


Leave a Comment:

RELATED ARTICLES

Prefer or defer? Sector and investment themes for 2021

Highlights of Cuffelinks 2013

banner

Most viewed in recent weeks

Building a lazy ETF portfolio in 2026

What are the best ways to build a simple portfolio from scratch? I’ve addressed this issue before but think it’s worth revisiting given markets and the world have since changed, throwing up new challenges and things to consider.

Get set for a bumpy 2026

At this time last year, I forecast that 2025 would likely be a positive year given strong economic prospects and disinflation. The outlook for this year is less clear cut and here is what investors should do.

Meg on SMSFs: First glimpse of revised Division 296 tax

Treasury has released draft legislation for a new version of the controversial $3 million super tax. It's a significant improvement on the original proposal but there are some stings in the tail.

Ray Dalio on 2025’s real story, Trump, and what’s next

The renowned investor says 2025’s real story wasn’t AI or US stocks but the shift away from American assets and a collapse in the value of money. And he outlines how to best position portfolios for what’s ahead.

10 fearless forecasts for 2026

The predictions include dividends will outstrip growth as a source of Australian equity returns, US market performance will be underwhelming, while US government bonds will beat gold.

13 million spare bedrooms: Rethinking Australia’s housing shortfall

We don’t have a housing shortage; we have housing misallocation. This explores why so many bedrooms go unused, what’s been tried before, and five things to unlock housing capacity – no new building required.

Latest Updates

3 ways to fix Australia’s affordability crisis

Our cost-of-living pressures go beyond the RBA: surging house prices, excessive migration, and expanding government programs, including the NDIS, are fuelling inflation, demanding bold, structural solutions.

Superannuation

The Division 296 tax is still a quasi-wealth tax

The latest draft legislation may be an improvement but it still has the whiff of a wealth tax about it. The question remains whether a golden opportunity for simpler and fairer super tax reform has been missed.

Superannuation

Is it really ‘your’ super fund?

Your super isn’t a bank account you own; it’s a trust you merely benefit from. So why would the Division 296 tax you personally on assets, income and gains you legally don’t own?

Shares

Inflation is the biggest destroyer of wealth

Inflation consistently undermines wealth, even in low-inflation environments. Whether or not it returns to target, investors must protect portfolios from its compounding impact on future living standards.

Shares

Picking the next sector winner

Global equity markets have experienced stellar returns in 2024 and 2025 led, in large part, by the boom in AI. Which sector could be the next star in global markets? This names three future winners.

Infrastructure

What investors should expect when investing in infrastructure: yield

The case for listed infrastructure is built on stable earnings and cash flows, which have sustained 4% dividend yields across cycles and supported consistent, inflation-linked long-term returns.

Investment strategies

Valuing AI: Extreme bubble, new golden era, or both

The US stock market sits in prolonged bubble territory, driven by AI enthusiasm. History suggests eventual mean reversion, reminding investors to weigh potential risks against current market optimism.

Sponsors

Alliances

© 2026 Morningstar, Inc. All rights reserved.

Disclaimer
The data, research and opinions provided here are for information purposes; are not an offer to buy or sell a security; and are not warranted to be correct, complete or accurate. Morningstar, its affiliates, and third-party content providers are not responsible for any investment decisions, damages or losses resulting from, or related to, the data and analyses or their use. To the extent any content is general advice, it has been prepared for clients of Morningstar Australasia Pty Ltd (ABN: 95 090 665 544, AFSL: 240892), without reference to your financial objectives, situation or needs. For more information refer to our Financial Services Guide. You should consider the advice in light of these matters and if applicable, the relevant Product Disclosure Statement before making any decision to invest. Past performance does not necessarily indicate a financial product’s future performance. To obtain advice tailored to your situation, contact a professional financial adviser. Articles are current as at date of publication.
This website contains information and opinions provided by third parties. Inclusion of this information does not necessarily represent Morningstar’s positions, strategies or opinions and should not be considered an endorsement by Morningstar.