Register For Our Mailing List

Register to receive our free weekly newsletter including editorials.

Home / 430

Many people misunderstand what life expectancy means

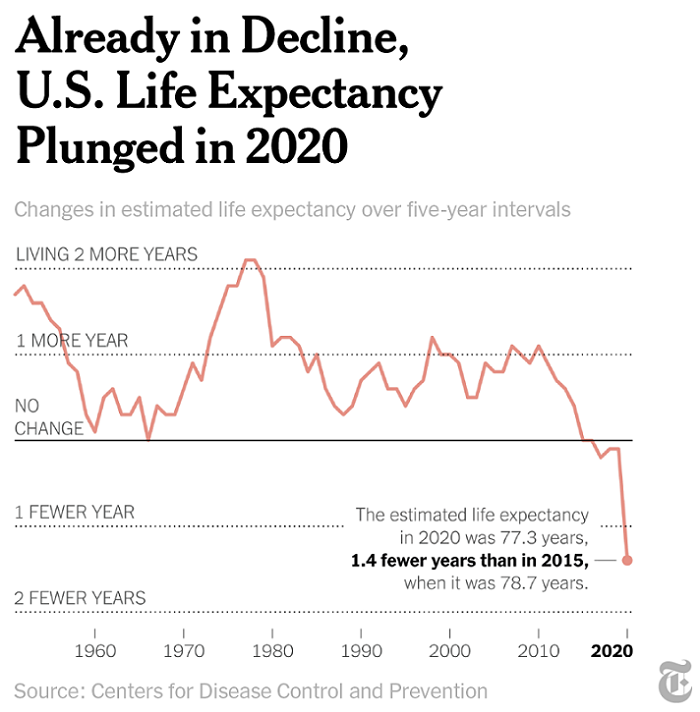
The New York Times headline screamed 'US Life Expectancy Plunged In 2020' on 21 July 2021. The sub-headline continued: “The 18-month drop, the steepest decline since World War II, was fueled by the coronavirus pandemic.” Specifically, life expectancy was reported to have declined from 78.8 years to 77.3 years.

This is such a big deal that The Times (of London) also headlined it: “Life expectancy gets even shorter for Americans.” They added that “Covid-19 was blamed for three quarters of the decline.”

What does the headline even mean?

Really? So all Americans expect to die a year and a half earlier than before (on average, of course)? That’s what the headlines mean, right?

No, not really, but the truth doesn’t make for as dramatic a headline. And if you can get an attention-grabbing headline, who cares if it isn’t accurate?

The true meaning of the statistics was, actually, reported accurately later in the New York Times article:

“If American children born today spent their entire lives under the conditions of 2020, they would live an average of 77.3 years, down from 78.8 in 2019.”

See the difference? If Covid-19 stays around in as virulent a form as in 2020, with no vaccinations or other defences against it, then … yes, future life expectancy will indeed fall.

I went to the actual report from the (US) National Center for Health Statistics (a part of the Centers for Disease Control and Prevention), and it was very clear:

“The period life table does not represent the mortality experience of an actual birth cohort but rather presents what would happen to a hypothetical cohort if it experienced throughout its entire life the mortality conditions of a particular period.”

Which is jargon for what I said in the previous paragraph.

A misunderstanding of life expectancy 

Why does this bother me? Because people misunderstand what life expectancy means. I’d greatly prefer it if it were instead called ‘the average survival age’, trying to avoid the macabre feelings that anything involving death can create. And what’s a ‘cohort’ anyway?

Let me explain.

A cohort is a group of people with a specific characteristic in common. When dealing with longevity, cohorts are usually defined by age and gender. For example, 'all female children born in 1970' or 'all males now aged 55' – that sort of thing.

‘Life expectancy’ means the average expected age to which members of the cohort in question will survive. ‘Expected’? There’s nothing expected about it. It’s a jargon word that means it’s the average of a distribution (perhaps even a very wide distribution) of possibilities.

For example … What does it mean if the life expectancy for people of your gender and year of birth is stated to be 80 years? It means that, if you look at all the people in that cohort (your gender, your year of birth), they will have a wide range of ages to which they will survive, and roughly half are expected to survive to some age short of 80 and roughly half to some age beyond 80.

That’s interesting, because the number is often (wrongly) interpreted as the expected limit of life, as if (in that example) 80 is the maximum age any of that group can be expected to reach. No, it’s not the maximum: it’s the average. There’s a 50/50 chance of outliving it.

It's higher for older people

Now here’s something that is even more often misunderstood. Suppose we subdivide that original group and now include only those who are still alive at age 50. What’s their likely average survival age? Is it still 80? No, it’s bound to be higher than 80. That’s because some of the original group have already passed on, before age 50. They brought the average down. The average for the group of survivors is therefore higher than 80. It might, for example, be 83.

That’s right, the definition of the cohort, the group, has changed. It’s no longer all of those who were born in your year of birth. It’s now limited to those who have survived beyond age 50. That’s a different group, even if the members of the (smaller) ‘survived to 50’ group were also part of the original ‘born in the same year as you’ group.

It’s like starting with ‘all people in the world’ and then changing to ‘all females’: the second group is different from the first one, even though all members of the (smaller) second group are also part of the first group. That’s a subtle distinction that the vast majority of people are unaware of. 

Similarly, those who survive beyond age 60 have an average projected survival age even higher. And so on. The older you are, the higher the average projected survival age.

One final rant on the way this ‘life expectancy’ was calculated. You’d think, since it deals with future survival, that it would reflect the possibility of improvement in health, the sort of trend that we’ve been used to for a couple of centuries. Of course you can never get it right, because it would require a crystal ball. And, to put it mildly, that’s impossible to find.

But what they’ve found isn’t a crystal ball, it’s a rear-view mirror, and indeed it only shows the immediate past.

Which brings us back to the headline.

There are potentially three aspects of it that are capable of misinterpretation.

First, the numbers only apply if Covid-19 (with no vaccination) and all other mortality-related conditions (including, for example, the opioid crisis) prevail forever.

Second, even when adjusted to reflect a probably more-promising future, the numbers don’t reflect the maximum age one can reach. Roughly half of us should outlive the stated expectancies.

And third, they apply only to newborns. The longer we survive, the higher the average age to which we will eventually survive. It's common sense when it’s expressed that way, isn’t it?

There! Even with such a morbid subject, I bring you nothing but good news!


Don Ezra, now happily retired, is the former Co-Chairman of global consulting for Russell Investments worldwide, and the author of “Life Two: how to get to and enjoy what used to be called retirement”. This article is general information and does not consider the circumstances of any investor.


  •   20 October 2021
  • 10
  •      
  •   
10 Comments
Steve
October 20, 2021

Fair points Don, but I could also say some people misunderstand the difference between average and median. One thing that this raises is should financial advisors and the financial industry in general use the life expectancy of that cohort that has reached say age 60 as a guide to how long their funds are expected to last in retirement? You would need to allow for another few years over and above the nominal whole population life expectancy. Most retirement calculators use the latter I believe.

Brnic
October 20, 2021

I wonder how the (very generalised) financial advisor community will react to these statistics? Will they update their deterministic projection calculations to show their clients that they can start spending more because they now need to provide for 1-2 years’ less income?! Are all their clients going to suddenly live a couple of years less…? Mind boggling…

ALLAN
October 21, 2021

"[...] Are all their clients going to suddenly live a couple of years less? Mind boggling..."

It's not "mind boggling" if looked at correctly. Whilst one can suddenly 'die', one cannot suddenly 'live' a couple of years less. QED

Jack
October 20, 2021

If you are lucky, or unlucky enough, to be in the last 5% of your cohort to survive, neither the average nor the median life expectancy is of much use to you. The problem is that you cannot know the future, but you have to assume there is a 5% chance that you might live to age 95 or more. Planning for your savings to expire at your life expectancy is inherently dangerous for 50% of the population! But why worry, there is always the age pension.

Geoff
October 20, 2021

Super calculators which spit out your life expectancy are particularly worrying as it's not immediately clear what it means. What I really want to know is what is the life expectancy of people who are the same age as I am, having survived thus far, not the ones that are already dead. That's useful info, and I still have a 50% chance of outliving it... but is that what I'm getting? Who knows...

Craig KELLET
October 20, 2021

Well, if you go to the ABS life tables - that is exactly what they do - give you the expected (average) life expectancy you have, for a given age and by sex. https://www.abs.gov.au/statistics/people/population/life-tables/2017-2019#data-download

Ramani
October 20, 2021

A boss of mine , an actuary like me, used to say ‘Obfuscation is a tool of every profession’. Demographers and death counting actuaries are no different.

The need to rework the conditional survival age (having survived a few years) explains the apparent inequity of an older human from the cohort enjoying a higher life expectancy. So the trick is to cheat death for a while, and on an average the Reaper will surely look grimmer.

Await an article soon why life insurers assume, for the same cohort, higher survival rates for annuitants but lower ones for the life assurance proponents. Bid and offer pricing really, suitably obfuscated.

Kindred professions are no better. Think of accounting and legal fictions that bamboozle the consumer!

Craig KELLET
October 20, 2021

One of my favourite sayings is "eschew obfuscation".

Sonja
October 23, 2021

As with a lot of statistics, the trend is more important than the actual number. Rising survival rates are associated with improving living conditions: health care, wages, road safety, etc. The opposite applies to falling survival rates and says a lot about living conditions in the US in 2020 and before.

Dan Pimental
October 26, 2021

Most people misunderstand life expectancy data. Life expectancy is the average. In societies with high infant mortality rates many people die in the first few years of life.


Leave a Comment:

RELATED ARTICLES

How not to run out of money in retirement

How long will you live?

Ageing in spurts

banner

Most viewed in recent weeks

The growing debt burden of retiring Australians

More Australians are retiring with larger mortgages and less super. This paper explores how unlocking housing wealth can help ease the nation’s growing retirement cashflow crunch.

Four best-ever charts for every adviser and investor

In any year since 1875, if you'd invested in the ASX, turned away and come back eight years later, your average return would be 120% with no negative periods. It's just one of the must-have stats that all investors should know.

LICs vs ETFs – which perform best?

With investor sentiment shifting and ETFs surging ahead, we pit Australia’s biggest LICs against their ETF rivals to see which delivers better returns over the short and long term. The results are revealing.

Family trusts: Are they still worth it?

Family trusts remain a core structure for wealth management, but rising ATO scrutiny and complex compliance raise questions about their ongoing value. Are the benefits still worth the administrative burden?

13 ways to save money on your tax - legally

Thoughtful tax planning is a cornerstone of successful investing. This highlights 13 legal ways that you can reduce tax, preserve capital, and enhance long-term wealth across super, property, and shares.

Our experts on Jim Chalmers' super tax backdown

Labor has caved to pressure on key parts of the Division 296 tax, though also added some important nuances. Here are six experts’ views on the changes and what they mean for you.        

Latest Updates

Investment strategies

Warren Buffett's final lesson

I’ve long seen Buffett as a flawed genius: a great investor though a man with shortcomings. With his final letter to Berkshire shareholders, I reflect on how my views of Buffett have changed and the legacy he leaves.

Property

The housing market is heading into choppy waters

With rates on hold and housing demand strong, lenders are pushing boundaries. As risky products return, borrowers should be cautious and not let clever marketing cloud their judgment.

Investment strategies

Dumb money triumphant

One sign of today's speculative market froth is that retail investors are winning, and winning big. It bears remarkable similarities to 1929 and 1999, and this story may not have a happy ending either.

Retirement

Can the sequence of investment returns ruin retirement?

Retirement outcomes aren’t just about average returns. The sequence of returns, good or bad, can dramatically shape how long super lasts. Understanding sequencing risk is key to managing longevity risk.

Strategy

How AI is changing search and what it means for Google

The use of generative AI in search is on the rise and has profound implications for search engines like Google, as well as for companies that rely on clicks to make sales.

Survey: Getting to know you, and your thoughts on Firstlinks

We’d love to get to know more about our readers, hear your thoughts on Firstlinks and see how we can make it better for you. Please complete this short survey, and have your say.

Investment strategies

A framework for understanding the AI investment boom

Technological leaps - from air travel to computing - has enriched society but squeezed margins. As AI accelerates, investors must separate progress from profitability to avoid repeating past mistakes.

Economy

The mystery behind modern spending choices

Today’s consumers are walking contradictions - craving simplicity in an age of abundance, privacy in a public world. These tensions tell a bigger story about what people truly value and why.

Sponsors

Alliances

© 2025 Morningstar, Inc. All rights reserved.

Disclaimer
The data, research and opinions provided here are for information purposes; are not an offer to buy or sell a security; and are not warranted to be correct, complete or accurate. Morningstar, its affiliates, and third-party content providers are not responsible for any investment decisions, damages or losses resulting from, or related to, the data and analyses or their use. To the extent any content is general advice, it has been prepared for clients of Morningstar Australasia Pty Ltd (ABN: 95 090 665 544, AFSL: 240892), without reference to your financial objectives, situation or needs. For more information refer to our Financial Services Guide. You should consider the advice in light of these matters and if applicable, the relevant Product Disclosure Statement before making any decision to invest. Past performance does not necessarily indicate a financial product’s future performance. To obtain advice tailored to your situation, contact a professional financial adviser. Articles are current as at date of publication.
This website contains information and opinions provided by third parties. Inclusion of this information does not necessarily represent Morningstar’s positions, strategies or opinions and should not be considered an endorsement by Morningstar.