We are often asked how value investing works in the tech sector. This usually assumes it is near impossible because most attractive technology companies (and a lot of unattractive ones) trade at high-looking multiples.
Yet simply comparing multiples is not an effective valuation framework because it neglects differences in business models, earnings quality, growth prospects and the crucial ability to generate future cash flows. Good businesses making sustainably high returns above the cost of capital can be trading at fair value - or be undervalued - even if their multiples look high.
Figure 1 shows how fair value Price-to-Earnings ratios (PEs) generally increase as earnings growth and the future return on invested capital (ROIC) increase over time. For tech-sector context, a supernormal growth period might be where a company’s new technology is rapidly taking market share. ROIC is a key measure of how effectively a business puts its money to work.
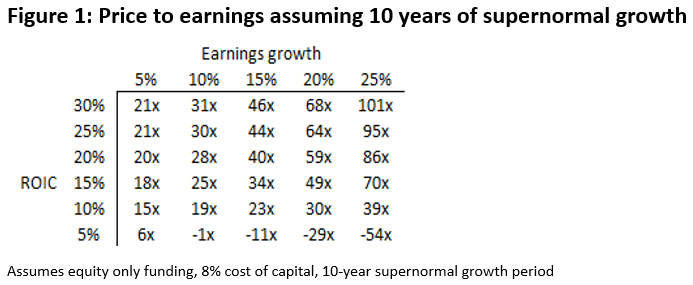
We can simplify this by comparing two hypothetical businesses each with $10 of earnings. CommodityCo sells a commodity widget with many competitors. Over the next 10 years, it could generate a 10% ROIC and grow earnings 10% p.a. before the business matures.
By contrast, MonopolyCo has pricing power, enjoys high barriers to entry and is expected to generate a 25% ROIC and grow earnings ~15% p.a. before maturing.
Figure 1 shows that MonopolyCo should be worth ~$440 (44x PE) vs CommodityCo at ~$190 (19x PE). Given an opportunity to buy MonopolyCo at 30x PE and CommodityCo at 20x PE, the counterintuitive conclusion is that MonopolyCo is undervalued, despite the higher multiple. CommodityCo is overvalued.
A process to find value
Instead of trying to buy companies at low PEs, value investing is about buying stocks at PEs lower than what they are worth. We execute this through a three-step process.
1. We attempt to understand a business’ future free cashflow1 generation potential. We ask what value they bring to customers, why they are preferred over competitors, where is their pricing power and whether management is trustworthy and executing the right strategy. Companies that rank favourably on these measures are higher quality and we expect they can sustain a high ROIC over a longer period of time relative to the average company.
We then seek to understand the industry growth rate, where the business is in its lifecycle, their potential to take market share and whether they can expand into adjacent fields. Companies that rank favourably on these measures have higher growth potential.
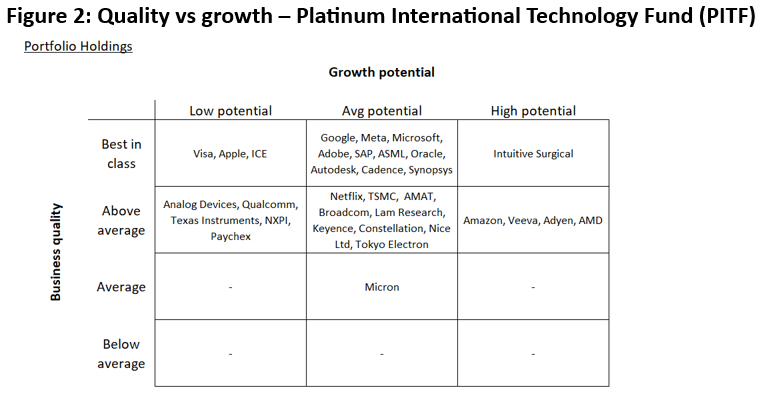
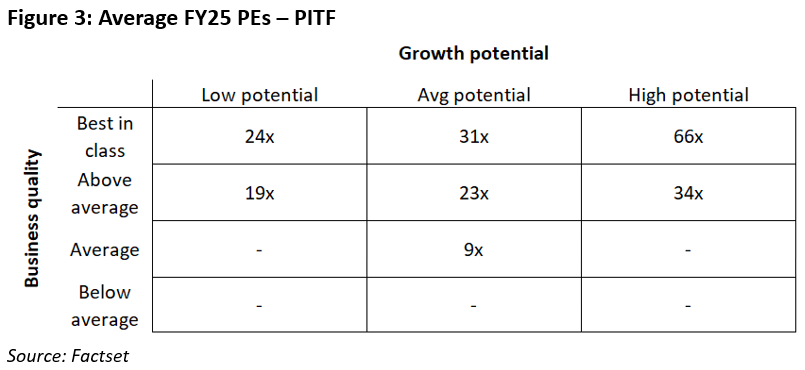
2. We then classify the business for quality and growth and compare its valuations to peers with similar characteristics in our portfolio (see Figures 2 and 3). At this point valuation discrepancies may appear and further investigation will reveal whether we have made a mistake in our assessment or that this discrepancy is due to a (potentially attractive) mispricing.
3. Finally, if a mispricing has occurred, we need to understand why. We believe these mispricings usually result from:
- The company faces a temporary setback and the market loses faith in its long-term earnings power or growth potential.
- The company is undergoing structural change.
Alphabet and Amazon
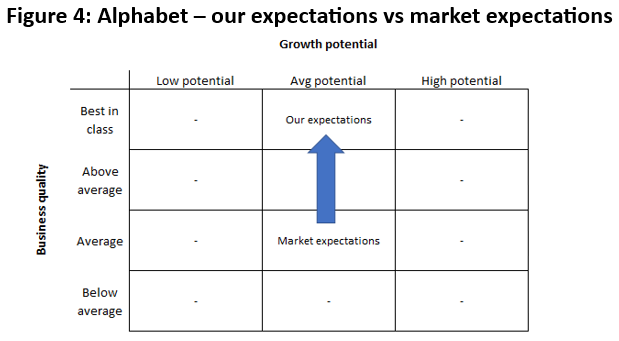
Alphabet is a good example of mispricing due to a temporary setback. Investors currently price Alphabet as an ‘Average’ business at ~19x FY25 PE as they are concerned genAI will disintermediate the search business. We believe Alphabet is a ‘Best in Class’ business and should trade at ~28x in line with peers (see Figure 4).
There is little market share data suggesting monetisable search (e.g. booking a holiday) is impacted by AI and large language models. Over the medium term, it’s hard to see how ChatGPT or Bing can attract a larger audience and offer advertisers a better ad product given Alphabet’s distribution strengths via Android, Chrome and YouTube and superior targeting based on data from services like Gmail and Google Maps.
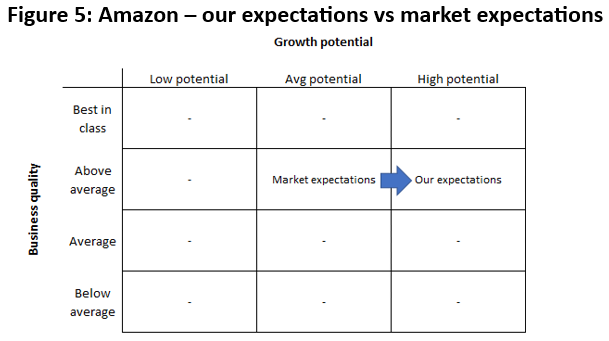
Amazon is an example of mispricing due to structural change. Investors currently price Amazon as an ‘Average Growth Potential’ business and borderline ‘Above Average’/’Best in class’ on quality at ~30x FY25 PE. We believe Amazon will rank as a ‘High Growth Potential’ business if it can monetise advertisements in its video streaming business.
We believe Amazon is uniquely positioned to capture a meaningful portion of the $60 billion of linear TV ad spend shifting to digital given the size of its content library, its unique access to user purchasing data and the ability to directly track performance on platform. Doing so will meaningfully change the earnings growth and ROIC trajectory of the retail business.
In conclusion, the real investment skill is to know when a stock on 30x is cheap and when a stock on 10x is expensive.
1 Free Cash Flow is the money a company has to pay debts and pay dividends. It's calculated after accounting for spending on operations and assets and often seen as a good measure of a company’s financial health.
Jimmy Su is Portfolio Manager of Platinum’s International Technology Fund. Platinum Asset Management is a sponsor of Firstlinks.
The above information is commentary only (i.e. our general thoughts). It is not intended to be, nor should it be construed as, investment advice. To the extent permitted by law, no liability is accepted for any loss or damage as a result of any reliance on this information. Before making any investment decision you need to consider (with your financial adviser) your particular investment needs, objectives and circumstances.
For more articles and papers by Platinum click here.