Register For Our Mailing List

Register to receive our free weekly newsletter including editorials.

Home / 399

The equity of government support for retirement income

For many years there has been considerable media debate about the fairness (or otherwise) of the superannuation tax concessions and the apparent advantage they provide to high income earners.

However, government support for retirement income comes from two main sources:

  • the direct age pension payments made by the government to many older Australians who have experienced low-moderate lifetime earnings, and
  • the superannuation tax concessions, in respect of concessional contributions (received during one’s working years) and investment earnings (received both before and after retirement).

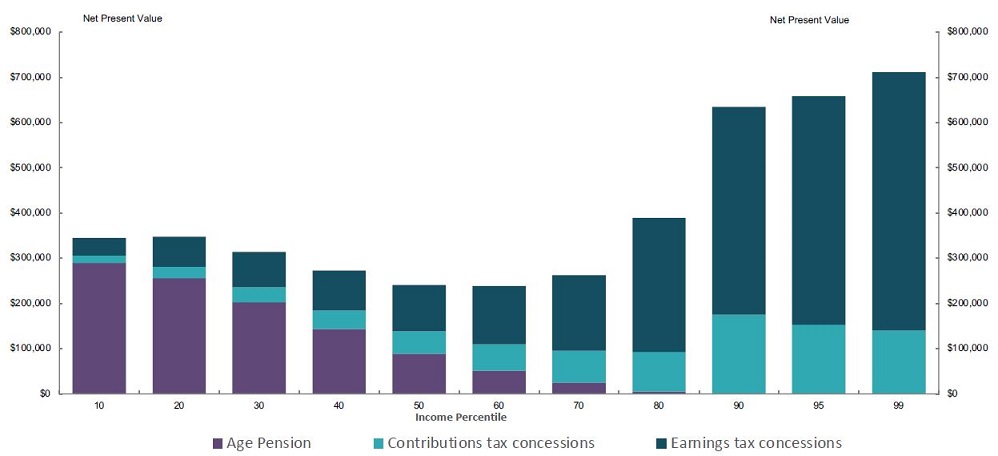
This is illustrated in the following graph taken from the Treasury consultation paper prepared for the Retirement Income Review which shows the level of lifetime government support at various income levels.

As expected, the value of the expected age pension payments reduce as incomes rise whereas the reverse applies in respect of the super tax concessions. This is chart is commonly used to demonstrate the inequity of superannuation concessions.

Government support for retirement incomes

Discounting to a present value requires assumptions

Of course, both the age pension payments and tax concessions are spread over several decades into the future. Therefore, to obtain a present value of the level of lifetime support in today’s dollars, it is necessary to discount these future payments and concessions.

The Treasury calculations discount these future levels of support at the assumed nominal GDP growth rate, or about 5% per annum. While this rate may be reasonable from the government’s perspective, as it allows for productivity gains and population growth, it is totally inappropriate when comparing the level of government support between individuals.

A lower rate relevant to individuals is needed.

The Retirement Income Review used the assumed wages growth of 4% pa until retirement and then the assumed inflation rate of 2.5% pa during the retirement years. So, to keep it simple, let’s use 3.5% pa. The results are shown below.

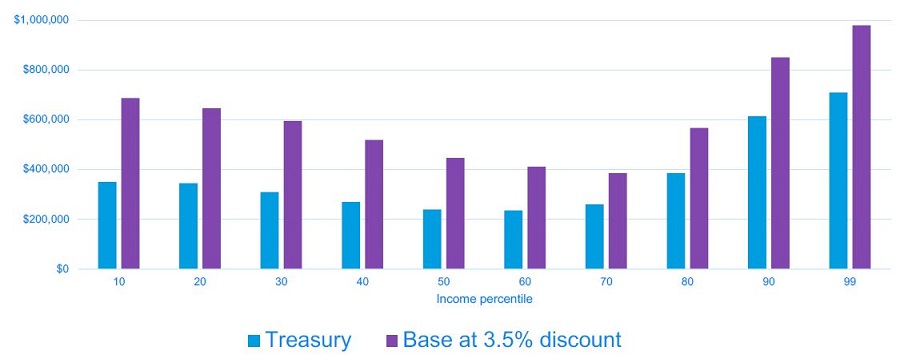
As expected, the present value of all these future payments increases when a lower discount rate is used. However, given that the age pension payments are further into the future than the superannuation tax concessions, the level of retirement income support received at lower incomes increases by a higher percentage than at higher incomes.

(For an analogy, growth stocks that are estimated to earn profits far into the future become more valuable when rates are lower, as the discount rate on the earnings is less. So important is this assumption that it has driven the value of growth stocks ever higher as rates have fallen over recent years).

A highly-different result

Indeed, the lowest three income deciles now receive more government support than the 80th income percentile. This is a very different result from the Treasury numbers.

It is also apparent that middle income earners receive less support than both high and low income earners. That is, there is a 'U-shape' in the level of government support.

One way of providing a fairer outcome is to reduce the assets test taper from $3 per fortnight (equivalent to 7.8%) to $1.50 per fortnight (or 3.9%). The next graph shows the effects of applying the lower deeming rates that applied in 2020 and halving the assets test taper.

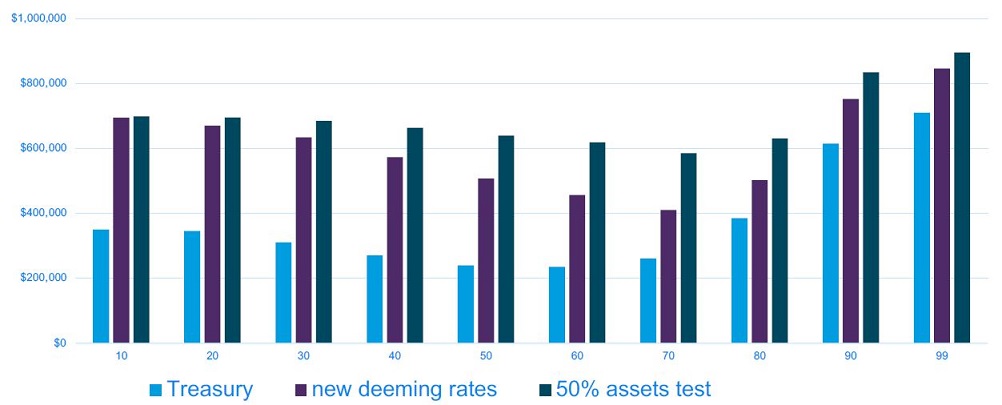
While the reduced deeming rates provide some improvement, the halving of the assets test taper provides a significant boost to the level of government support to middle income earners as more age pension payments will be received by these individuals.

In fact, this is a similar result to that shown in the Final Report of the Retirement Income Review through their somewhat unrealistic assumption that retirees could spend their assets down more quickly than normal and so receive increased age pension payments.

One final comment

Even with the halving of the assets test taper, the highest income decile receives the highest level of government support due to their high levels of superannuation and the resulting tax concessions.

However, the approach adopted by Treasury in valuing these concessions is misleading as it assumes that these individuals would pay the highest marginal tax rate on their investment earnings if there was no superannuation. This is unrealistic as I’m sure they would find other legal means to reduce their tax.

In summary, the level of government support for retirement income across different income levels is not as unequal as often claimed. Indeed, if the assets test taper were halved, the level of support would be remarkably level across all incomes.


Dr David Knox is a Senior Partner at Mercer. See www.mercer.com.au. This article is general information and not investment advice.


36 Comments
Pecked Pigeon
March 24, 2021

John, the maximum you could contribute to CSS with employer contribution was 5% of salary. What kind of salary would you have to be on to accumulate $650k? I started work on $9k p.a. Nor is the lump sum available at retirement, just own contributions. It is paid as a form of lifetime annuity.

Nick Callil
March 22, 2021

As David and Kevin Davis note – the desirable shape of the chart is an interesting question.

David prefers a broadly level chart. I believe there is a case for a “tilted V” shape i.e. flat at lower incomes but upwards sloping beyond (say) the 30th income decile.

My reasoning is:

(1) At lower income level, enough support should be provided to ensure no Australian lives in poverty. This will be largely through the age pension.

(2) At higher incomes, the progressive nature of our personal tax system becomes relevant. Higher earners will pay higher amount in tax over their lifetimes hence it is reasonable that the dollar value of tax concessions for retirement income are higher to reflect that. As Ken Henry has said: not every element of the tax & transfer system must individually must meet any particular objective (in this case, progressivity) – it is the overall system that matters. Even with an upward sloping chart, the overall tax and transfer system (including superannuation concessions) is (appropriately) progressive.

Note however I favour caps on the dollar amount of taxation support for very high income earners. Going forward, the contribution caps largely achieve this.

VicVictor
March 22, 2021

As per usual the politics of envy rears its head with this topic. Lets all just accept that the 20 century has shown that unless you provide incentive to save (including China) you're not likely to do so as see by 70% of retirees with their hands out for the Age Pension. We all need to accept that the 30% not in this cohort aren't going to pay top MTR on investments made outside of super so Treasury's assumption is unrealistic if not absurd. It's remained the assumption simply for political reasons. The question then becomes what's a more optimal long term approach?

Ruth
March 24, 2021

Well said.
What are they trying to do? Make everyone poorer? The key is to raise all through productivity, not have endless govt committees restributing wealth like chickens stratching around a pen taking feed from each other.

Greg
March 21, 2021

Given that it is Government expenditure that we are talking about the appropriate discount rate would be the Government borrowing rate, being the bond rate.

Tony Dillon
March 20, 2021

Further to my numerical example on 19 March below. The Retirement Income Review says that estimating super tax concessions involves considering the “counterfactual tax benchmark”, which means it compares the tax treatment of contributions and earnings in a super tax setting, with those in a personal income tax system. In other words, it compares the tax paid on super savings with what would have been paid had the savings been in an ordinary savings environment. The difference being the “tax concession”.

In my example therefore, the “concession" in the first year would be $1,460 for someone earning $100k, assuming a personal marginal tax rate of 30% for simplicity (currently 32.5%). The contribution concession being $9,500 x (0.3 - 0.15) = $1,425. The rest being the concession on earnings. Over the 30 years, the earnings tax concession works out to be $1407, undiscounted.

However, this comparison assumes taxpayer behaviour is unchanged. How likely though, would the salary earner be prepared to “save” if favourable tax treatment didn’t exist? And compulsory savings surely would not be implemented without concessional tax treatment. So the "tax concession” is only a concession to the extent that the $9.5k would have instead been taken as salary, and invested outside of super.

In any case, my example shows that the overall tax rate after 30 years on the $9.5k invested, is 30%. The same as the marginal rate that would have applied to the $9.5k if taken as salary and consumed today. So deferring consumption for 30 years leads to the same 30% rate of tax. My point being then, how real are the “tax concessions” in the report?

Steve
March 20, 2021

With the harsh asset & income test, there is virtually no incentive for couples to save over $450,000 in assessable assets. Unlike NZ, which has no income or asset test & there is an actual incentive for retirees to save. All fund managers in Australia should be lobbying the Federal Govt to move to the NZ system.

Wally
March 19, 2021

Thanks SMSF Trustee. Did you understand the question? Let us not compare the size but rather how much risk- free pension is actually received by DB super against the high risk SMSF. So how much pension does Captain Hi Pants receive on his privileged AUD$650k in $$$$. His words not mine. 

SMSF Trustee
March 20, 2021

Wally, if I've answered a different question to the one you intended, then perhaps that's because of the way you worded it - you asked for a comparison between a $650k Defined Benefit contribution and a $650k SMSF and I said that you can't answer that question without knowing what the defined benefit is. It might pay the same, less or more than the income on an SMSF of that size. You also have to take into account the remuneration that the recipient was paid during their working life as often having a DB scheme is a bit of an offset for a lower salary.

You need more information. I think that actually does answer your question, as best as it can be answered.

John
March 23, 2021

Does it help to know that for Federal CSS DB recipients who retired from Commonwealth employment at 55 (as many do but may still work elsewhere), the DB pension was 9.55% of 250% of one's total contributions and accumulated earnings. e.g. Suppose the account held $100k, the retiree is given $100k back tax free, then the scheme assumes $250k remains and the pension (65% of which is reversionary on death) becomes $23,875 p.a. indexed for life (average 30 years) twice a year at the same rate as for aged pensioners. This is almost identical to the single aged pension, without the eligibility hurdle. Because the pension comes from an unfunded source (Future Fund), it is taxable, but with a 10% tax offset. i.e. often no tax at all. That pension level was achievable with less than 10 years service, starting age 27, before moving to the "real world". Little wonder CSS was closed to new members 30 years ago.

SMSF Trustee
March 24, 2021

John, yes it does help, to some degree. But it leaves out a lot of important information to help someone like Wally who seems to think the scheme is an over-generous rip-off to understand the financials of it.

In particular, CSS is a hybrid scheme, with both parties putting into it. The employee contributes at a lower rate than the Super Guarantee Charge (5% or less according to the CSS website). The employer (ie Government) puts in an additional component. This is in reality similar to someone in an accumulation fund, except the way the contribution is structured is as a payment by the employer out of pre-tax earnings. In both schemes, it's a cost to the employer that is a part of the remuneration paid to the employee.

Thus, the on-going pension payment that you mentioned is a payment linked to the amount that the employer has put in and earnings on that part of the fund. It's also funded by the fact that if someone dies soon after retiring, the fund doesn't have to pay out as much as someone who lives a long time - so it's a scheme that has elements that look a bit like a lifetime deferred annuity structure.

The defined benefit formula had been worked out actuarially based upon longevity and investment return assumptions. Of course, once both of those things changed over the last 20 years or so (life expectancy has lengthened and return expectations have fallen) such schemes needed to close because the formula no longer worked.

But the impression you gave in your response was that this was a huge additional payment for public servants over and above what folk who aren't so lucky get from their super. That is simply not true. It would have been had the scheme been kept open to new members once the investment parameters changed, but the scheme closed when it had to once the actuarial numbers showed that it wasn't sustainable any more.

So, perhaps, no, your comment isn't helpful because it leaves out too much information about how the scheme works and just furthers the misunderstanding of how the public service super schemes have worked over the years. Were they too generous? We still don't have enough information from your response to be able to assess that.

Tony Dillon
March 18, 2021

Interesting article. Though it would be useful to know how the super tax concessions are actually calculated. I suspect they may be overstated, being calculated at 15% on contributions and earnings as they arise before and after retirement. Yet if you look at the effect of taxation on contributions and earnings on the end benefit, it appears the tax concessions may not be as favourable as reported.

For example. Someone on $100k today is due to retire in 30 years. Of which, $9,500 is super. After contributions tax, $8,075 goes in, and assume the fund earns 4.50% p.a. The net rate after tax being 3.83%. At the net rate, the $8,075 grows to $24,900 after 30 years.

Whereas if the full $9,500 was to grow at 4.50% for 30 years, the end result would have been $35,600. So the effective tax rate on the end benefit is a full 30%. Double the headline tax rate.

David Knox
March 18, 2021

A quick response to Graeme's question

The superannuation tax concessions apply in respect of both contributions (which are paid before retirement) and investment earnings (which are received both before and after retirement) whereas the age pension payments are only received after retirement. Hence, on average, the age pension payments are received later than the super tax concessions.

Trevor
March 18, 2021

"For many years there has been considerable media debate about the fairness (or otherwise) of the superannuation tax concessions and the apparent advantage they provide to high income earners ". Just "who" defines fairness? Condemn the high income earners, the most competent, the most successful, the most valuable members of "our" society [...otherwise "we" wouldn't pay them so much, would "we"?] So, what do you want? Lots of low income people earning hand-outs instead? No gratitude for the valued and highly taxed contribution. We all have it so good in Australia! There has NEVER been a better time to be alive but all we get is envy and avarice! They say that "the road to hell is paved with good intentions" but the other side of that is that not all paved roads lead to hell. 

GES
March 17, 2021

The difficulty I see with David’s paper and the comments thereon are that they address a problem I had hoped had been largely solved for future generations by the Transfer Balance Cap in 2017. It must have been generally recognised at the time of the new legislation that it could not undo all the faults of poor legislation in the past; some perceived “unfair” advantages gained legitimately by a few individuals of the current generation would unavoidably remain as a legacy of the continuing system and allowed to wither on the vine.
Yet David’s paper made no attempt to remove this temporary (but significant) influence of over-large balances when measuring perceived equity between income earner deciles (or asset deciles for that matter) in a mature system. If it had, the analysis would, in my view, provide a sounder basis for indicating what further measures (if any) might be taken.
The 2017 legislation was intended to (and did) reverse the generosity of pre-2007 amendments that had blithely abandoned then-existing maximum benefit limits intended to prevent the accumulation of over-large balances within the superannuation system. We should be wary of taking further precipitate action based solely on a snapshot from an immature system.

Graeme
March 17, 2021

The logic and conclusion of your article relies on your statement: "age pension payments are further into the future than the superannuation tax concessions". Your first graph shows that the vast majority of superannuation tax concessions for higher income percentiles are earnings tax concessions - some of which will be received pre-retirement and some (much?) of which will be received post-retirement at the same time in the future as the age pension payments accruing to those in the lower income percentiles.
Can you please justify your statement.

David Knox
March 17, 2021

Kevin Davis raises the interesting question as to the desirable shape of this graph. For example, should it be level or downward sloping? I have taken the view that a broadly level graph is preferable to one that is either U-shaped or upward sloping. Of course, that raises the question as to the purpose of retirement income support.

I think there are two reasons:
1 To support the poor
2 To provide some compensation for those who are unable to access their deferred wages due to preservation

Kate Borond
March 17, 2021

Of course the one thing left unconsidered is how the average SMSF individual fares when they have just enough to be ineligible for the pension, but due to falls in interest rates to basically xero, they either have to up their risk profile and invest in things they might not understand the risks of fully and/or live on capital. ( end result not doubt they will become eligible for the pension)
Ask any polititian what was done during COVID for these people and you will find this does not compute as they are the forgotten in betweeners. Meanwhile, those on unemployment , who were sat at home with nothing to spend it on and nowhere to go received double the normal payment. And then there are the Harvey Norman's of this world !!!
the whole thing is an out of control mess.

SMSF Trustee
March 17, 2021

If they were running an SMSF and didn't understand investments with any capital risk involved then they shouldn't have been running an SMSF in the first place!!!!!

David Williams
March 17, 2021

This excellent analysis underlines the need for a National Longevity Strategy for Australians. This would include oversight of decisions relating to longevity by Treasury (Tax and Super) , Social Services (Age Pensions), NDIS, Health and Aged Care, Employment (Age Discrimination and Jobs). We should also include Education: it is a disgrace that we have failed to provide quality longevity education from midlife (compared with what has been done for financial literacy).
Effective integration of these silos through a National Longevity Strategy would go a long way to underpinning our ability to afford the necessary repairs to the aged care system. It would also highlight the importance of making better use of the longevity bonus that continues to accrue to the majority of Australians as they age.

Kevin Davis
March 17, 2021

Regardless of the calculations, isn’t the rationale for retirement incomes support policy to assist those unable to adequately finance a reasonable level of living standard in retirement from their own resources. So, rather than focusing on whether the level of government support is relatively equal across the income distribution, the desirable outcome should be that it declines for higher income levels. That is socially optimal policy (sat least from my perspective) should see the graph having much lower height at higher income deciles. Even the most favourable assumptions in the article show that we’re miles away from such an outcome!

Ian
March 20, 2021

You are ignoring the important "one final comment" in the article. This points out that the Treasury analysis makes the incorrect assumption that, without Super concessions, the wealthier folk would be subject to the top marginal rate on their earnings. In practice they would at least focus on generating capital gains which are taxed at half rates and deferred indefinitely until realised. This comes after they first maximize their investment into owner occupied housing which is completely tax free!. This is what we are seeing now. For people making big money now, Super is irrelevant (given the caps on contributions) and they are investing big time in owner-occupied housing. Then they buy investment property.

Jon Kalkman
March 17, 2021

Thank you for an insightful analysis of the relative levels of taxpayer support for the various income deciles in retirement. Maybe there is another way to look at this. We could look at assets.

The Retirement Income Review noted that there are over 11,000 people, each with more than $5 million in their super fund and each claiming more than $70,000 per year in tax concessions. Indeed, according to one report, the top 100 SMSFs together account for $7.9 billion, or an average of $79 million each. At the same time the ATO reports that the median SMSF is about $700,000. Therefore, 50% of SMSFs are actually smaller than this.

The problem with reporting aggregate super tax concessions, as the Retirement Income Review has done, is that the tax concessions flowing to a small number, but extremely wealthy super funds clearly distort the whole debate about tax concessions flowing to superannuation as a whole.

It may be more meaningful to do this analysis of comparative levels of tax concessions based on retiree’s assets rather than income because funds with such large assets are likely to more concerned with growth than income. Importantly, it would show how these large super funds have been able to benefit from the generous contribution rates that existed before 2007 and are therefore still benefiting from the concessional super tax rates that apply even after the introduction of the Transfer Balance Cap in 2017. It would still show the effects of the Centrelink taper rate because the assets test is the main determinant of the part-pension.

Such an analysis is likely to show that the median SMSF receives very little in tax concessions from super and these retirees also receive very little pension because of the taper rate. It may put an end to the assumption, made by many uninformed commentators, that anyone with a SMSF belongs to the “top end of town”

Alan Freshwater
March 17, 2021

Great analysis which puts all the moving parts into perspective. In my experience working with pre- retiree clients, the level of knowledge of how the super/retirement income and social security systems work is very low. Those that are prepared to understand it and perhaps seek advice get much better retirement outcomes and in fact have a much greater sense of control and therefore peace of mind

Dudley.
March 17, 2021

1. What outcome with no assets taper? [Guess: all age pension age eligible better off.]

2. What outcome when (tax paid - welfare benefits) = net tax used? [Guess: low incomers receive, high incomers pay.]

Wally
March 17, 2021

Would like to see how the Defined Benefit Super Schemes of politicians and public serpents compares to your data. They have no skin in the game they want to change but sleep well as their super is linked to CPI increases.

Given that the public sector receive annual wage increases whilst the private sector employees wages are stagnant there is more to this story.

How much super does a politician need in a SMSF to match the million dollar Defined Benefit pensions they currently enjoy.?


SMSF Trustee
March 17, 2021

Wally, stop living in the past. The public sector super scheme hasn't been defined benefit for years and neither has the politicians' one.

Captain Hi pants
March 17, 2021

just be aware that with Defined Benefit Super Schemes in pension mode payments over 100K per annum is taxed at 15%
With the Defined Benefit Super Schemes for politicians I do not know if they (the politicians) actually paid for the Defined Benefit Super Scheme but for my own Defined Benefit Super Scheme it cost me $650K AUD for the privilege

Wally
March 18, 2021

Thanks Captain Hi pants....point taken.

To be clear, just how much income does a Defined Benefit Super Scheme of AUD$ 650 k generate ??

Would be great to compare this with a SMSF .

Looking forward to your reply.

SMSF Trustee
March 18, 2021

Wally, you can't calculate the income from a defined benefit scheme based upon how much the beneficiary has paid in. They pay a defined benefit, usually linked to the final salary or some other measure. They're not market linked. In the case of someone who's paid in $650k, if that's not enough to generate the income needed to pay the defined benefit, then the scheme sponsor (in the public sector case, this is the government) has to supplement the scheme to enable the benefit to be paid.

I know that a private scheme I was once involved in was overfunded and the extent of overfunding was treated by the company as additional reserves on their balance sheet that they could spend however they liked. It didn't belong to the members of the scheme. But, an underfunded scheme is a liability of the sponsoring company, so they have to raise funds to be able to honour the defined benefits.

Jim
March 20, 2021

In response to Wally and Captain Hi pants.

Having previously worked for a state-based DB scheme, the rule-of-thumb was that if a member chose a lump sum at retirement (instead of a lifetime DB pension), then the lifetime rate-of-return they would require on the lump sum to achieve an equivalent outcome to the DB pension is *11% p.a.*

Good luck with that.

It also explains why so many DB schemes were replaced with DC around 30 years ago, and why the Federal Government set up the Future Fund.

Steve S
March 22, 2021

Surely the earnings tax concessions enjoyed by the top deciles in Pension Mode will be eroded by the Transfer Balance Cap rules. Understand that there is still a concessional alternative, being the accumulation route, but not to the same extent as the pension route.

John
March 23, 2021

Wally, assume the $650k account balance at retirement example used elsewhere in this thread. Extrapolating my experience, the DB benefit for such a Federal public servant CSS participant retiring at age 55 would be: $650k x 2.5 x 9.55% = $158k pa, taxable with a tax offset of 10%, indexed for life, 65% reversionary, plus a tax free (but not levy free!) refund of the $650k, which can optionally be used to generate a second CSS pension on less generous (but better than market) terms. My example is 10 years old, but the rules likely remain for those who joined the APS before CSS closure around 1990. It's feasible for someone joining at age 20 in (say) 1980, working in the APS for 35 years, never rising above middle management.

Pigeon Pecked
March 24, 2021

John I don't know where you get your figures from. But I joined in 1981. My pension is far less than what you calculate, and I was in middle management. And if I die, my estate gets nothing. It is politicians and judges who have the best of it. Also examine the state govt super schemes. These are constitutionally protected funds. The fed govt cannot tax the states, so they escape all fed taxation.

SMSF Trustee
March 24, 2021

OK, John, but you're still not comparing apples with apples.

Someone with $650k in an SMSF has built that up by contributing the SGC and then it earning income to accumulate that amount.

Someone with $650k as their own contributions plus earnings in the CSS scheme has clearly been on a higher salary in the first place, because they've accumulated the same amount after contributing less than the SGC themselves. This is because the government has put in their contribution on top of the employee's. And it's clear that someone on a higher salary accumulates more than someone on a lower salary!
Further, the imputed amount that's accumulated from the government contribution might look really generous, but that income payment can't be compared with a lump sum permanently invested because it stops when the beneficiary dies (or at least when their spouse dies). So it can afford to be calculated at a rate that is above investment returns because it's more like a deferred lifetime annuity and if the beneficiaries are gone within a year or two of retirement then what they would have been paid is in the pool that gets paid to others.

Another way the pool got boosted was that anyone who joined the public service but left after, say, 6 years, only got paid their contributions and earnings. Whatever the government had put in - at least notionally as most of this wasn't actually funded, but the economics are the same - whatever the government put in during those 6 years is forfeited into the scheme, providing a buffer between any shortfall in investment earnings and the defined benefit payments to those who do stay in it for a long time. DB schemes are designed to reward employees who remain with the employer for a long time.

The average return paid to all beneficiaries is in line with market returns, but each individual can be paid more than that because the pool is grown when someone dies or leaves within a couple of years of commencing.

The scheme closed when the combination of the longevity assumptions and the investment return assumptions got out of line with new actuarial analysis that said people are living longer and investments are returning less.

Look, I'm not an expert in this field. But it really annoys me when people use half-baked partial information to make it sound like the public servants scheme was an overly generous one that someone richly rewarded laziness. It didn't, at least not for most of its existence. Then when it started to be overly generous, it closed to new members. Neither the scheme, nor the public servants who were in it, deserve to be smeared with accusations of excess.

Pecked Pigeon
March 24, 2021

I will add that the 10% offset was a concession made because employees were required to contribute from post-tax dollars, not pre-tax dollars. Nor is there any control over what can be withdrawn each year. The scheme has been closed for many years and most are on modest pensions. You are comparing apples with oranges. Where did you get your $650k from? It is a wild exaggeration.


Leave a Comment:

RELATED ARTICLES

Retirement spending: set the bar lower

How super funds can better help with retirement planning

Keep mandatory super pension drawdowns halved

banner

Most viewed in recent weeks

2024/25 super thresholds – key changes and implications

The ATO has released all the superannuation rates and thresholds that will apply from 1 July 2024. Here's what’s changing and what’s not, and some key considerations and opportunities in the lead up to 30 June and beyond.

The greatest investor you’ve never heard of

Jim Simons has achieved breathtaking returns of 62% p.a. over 33 years, a track record like no other, yet he remains little known to the public. Here’s how he’s done it, and the lessons that can be applied to our own investing.

Five months on from cancer diagnosis

Life has radically shifted with my brain cancer, and I don’t know if it will ever be the same again. After decades of writing and a dozen years with Firstlinks, I still want to contribute, but exactly how and when I do that is unclear.

Is Australia ready for its population growth over the next decade?

Australia will have 3.7 million more people in a decade's time, though the growth won't be evenly distributed. Over 85s will see the fastest growth, while the number of younger people will barely rise. 

Welcome to Firstlinks Edition 552 with weekend update

Being rich is having a high-paying job and accumulating fancy houses and cars, while being wealthy is owning assets that provide passive income, as well as freedom and flexibility. Knowing the difference can reframe your life.

  • 21 March 2024

Why LICs may be close to bottoming

Investor disgust, consolidation, de-listings, price discounts, activist investors entering - it’s what typically happens at business cycle troughs, and it’s happening to LICs now. That may present a potential opportunity.

Latest Updates

Shares

20 US stocks to buy and hold forever

Recently, I compiled a list of ASX stocks that you could buy and hold forever. Here’s a follow-up list of US stocks that you could own indefinitely, including well-known names like Microsoft, as well as lesser-known gems.

The public servants demanding $3m super tax exemption

The $3 million super tax will capture retired, and soon to retire, public servants and politicians who are members of defined benefit superannuation schemes. Lobbying efforts for exemptions to the tax are intensifying.

Property

Baby Boomer housing needs

Baby boomers will account for a third of population growth between 2024 and 2029, making this generation the biggest age-related growth sector over this period. They will shape the housing market with their unique preferences.

SMSF strategies

Meg on SMSFs: When the first member of a couple dies

The surviving spouse has a lot to think about when a member of an SMSF dies. While it pays to understand the options quickly, often they’re best served by moving a little more slowly before making final decisions.

Shares

Small caps are compelling but not for the reasons you might think...

Your author prematurely advocated investing in small caps almost 12 months ago. Since then, the investment landscape has changed, and there are even more reasons to believe small caps are likely to outperform going forward.

Taxation

The mixed fortunes of tax reform in Australia, part 2

Since Federation, reforms to our tax system have proven difficult. Yet they're too important to leave in the too-hard basket, and here's a look at the key ingredients that make a tax reform exercise work, or not.

Investment strategies

8 ways that AI will impact how we invest

AI is affecting ever expanding fields of human activity, and the way we invest is no exception. Here's how investors, advisors and investment managers can better prepare to manage the opportunities and risks that come with AI.

Sponsors

Alliances

© 2024 Morningstar, Inc. All rights reserved.

Disclaimer
The data, research and opinions provided here are for information purposes; are not an offer to buy or sell a security; and are not warranted to be correct, complete or accurate. Morningstar, its affiliates, and third-party content providers are not responsible for any investment decisions, damages or losses resulting from, or related to, the data and analyses or their use. To the extent any content is general advice, it has been prepared for clients of Morningstar Australasia Pty Ltd (ABN: 95 090 665 544, AFSL: 240892), without reference to your financial objectives, situation or needs. For more information refer to our Financial Services Guide. You should consider the advice in light of these matters and if applicable, the relevant Product Disclosure Statement before making any decision to invest. Past performance does not necessarily indicate a financial product’s future performance. To obtain advice tailored to your situation, contact a professional financial adviser. Articles are current as at date of publication.
This website contains information and opinions provided by third parties. Inclusion of this information does not necessarily represent Morningstar’s positions, strategies or opinions and should not be considered an endorsement by Morningstar.