Division 296 has long been framed as a tax on the ultra-wealthy, but new data suggests it is likely to reach far deeper than the headline $3 million threshold implies.
The standout finding from Class's benchmark data is not the number of members already caught by Div 296. It is the sheer stockpile of unrealised gains sitting inside SMSFs. Nearly three-quarters of funds held a positive net unrealised capital gains position at 30 June 2026, averaging around $620,000.
Among funds with a member balance above $3 million, that figure jumps to $2.2 million and rises to almost $8 million for those with balances above $10 million
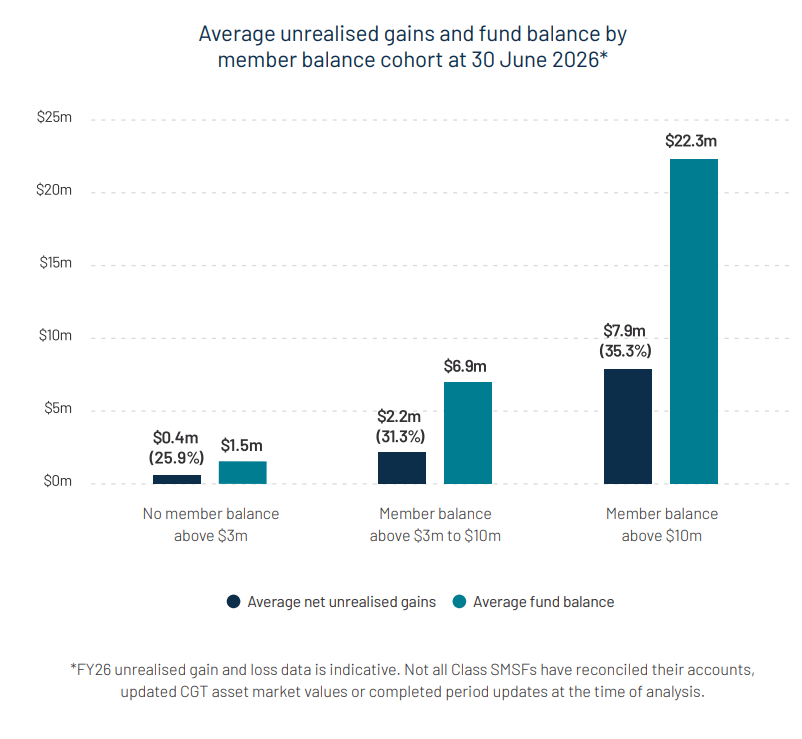
The legislation offers a one-off opportunity to reset the cost base of all CGT assets to market value as at 30 June 2026 for Div 296 purposes. This is an all-or-nothing election. Trustees cannot cherry-pick assets and once the decision is made there is no turning back.
The instinctive assumption is that this is a problem for today's wealthy SMSFs. Yet there are a number of funds standing just outside the spotlight. Only 8.8% of Class SMSFs currently have a member balance above $3 million, but another 9.4% sit in the $2-$3 million range.
Many who consider Div 296 someone else's problem may discover it is only a matter of time before it becomes their own.
Residential LRBA restrictions may have more impact than expected
The debate around borrowing in super has largely fixated on the size of the market. The more important question is whether policymakers underestimated just how embedded residential property leverage had become in the SMSF psyche.
In the year before the restriction on new residential property LRBAs took effect, almost 93% of all LRBA holdings on the platform were tied to residential property. Interestingly, Class identified 3,672 new residential property LRBA holdings in FY25. This points to an estimated 11,500 new arrangements across the broader SMSF sector if extrapolated nationally. It’s hard to argue this is a niche strategy in its twilight years.
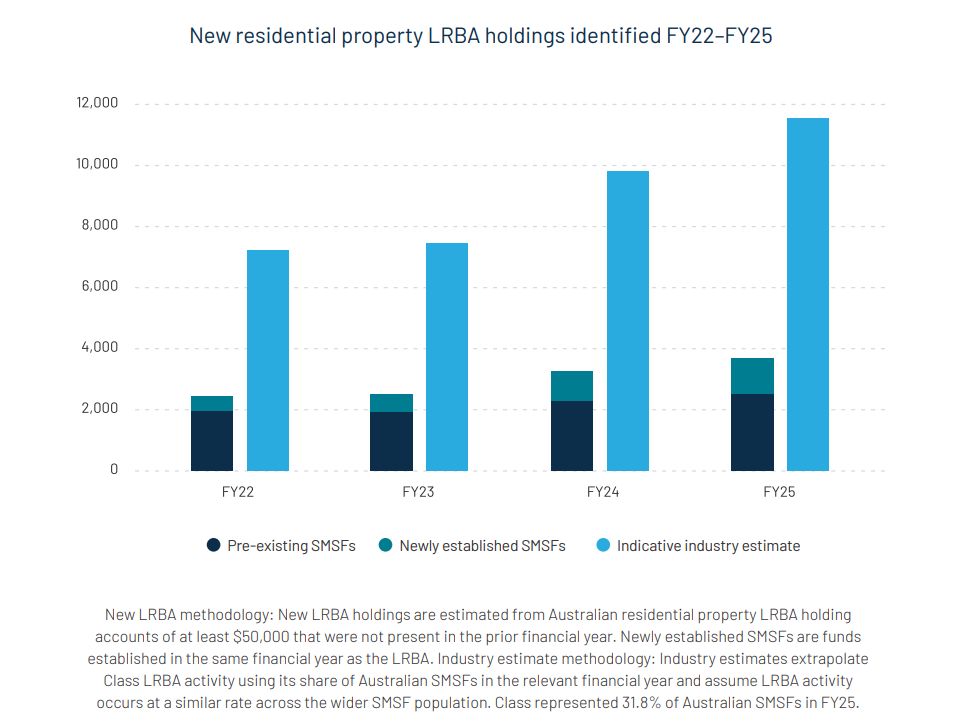
The strongest growth came from newly established SMSFs where residential LRBA activity more than doubled over 2 years. Perhaps that suggests the SMSF proposition was increasingly being built around the national conviction that property financed with debt remains the surest path to long-term wealth.
This partially challenges the notion set by policymakers that may have viewed residential borrowing as a relatively contained feature of the SMSF landscape. There appears to be far broader participation and stronger growth than many expected.
Asset allocation
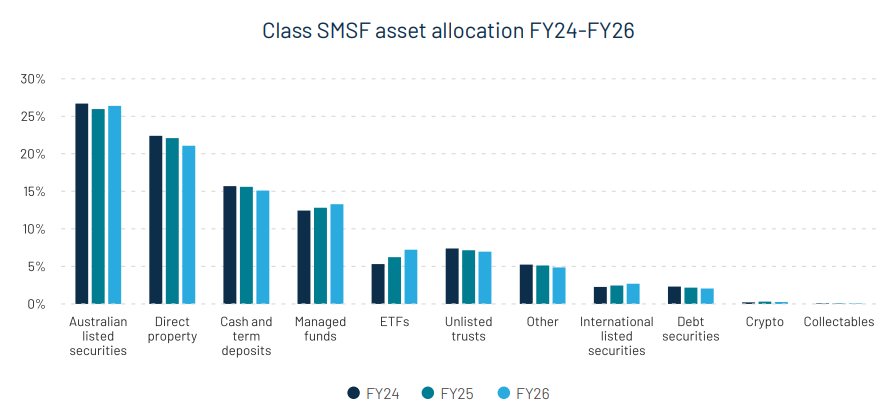
Listed Australian shares and direct property remained the two most popular assets, accounting for 26.4% and 21.1% of assets respectively. The most obvious movement was in ETFs, which increased 1% to reach 7.2% of assets, overtaking unlisted trusts.
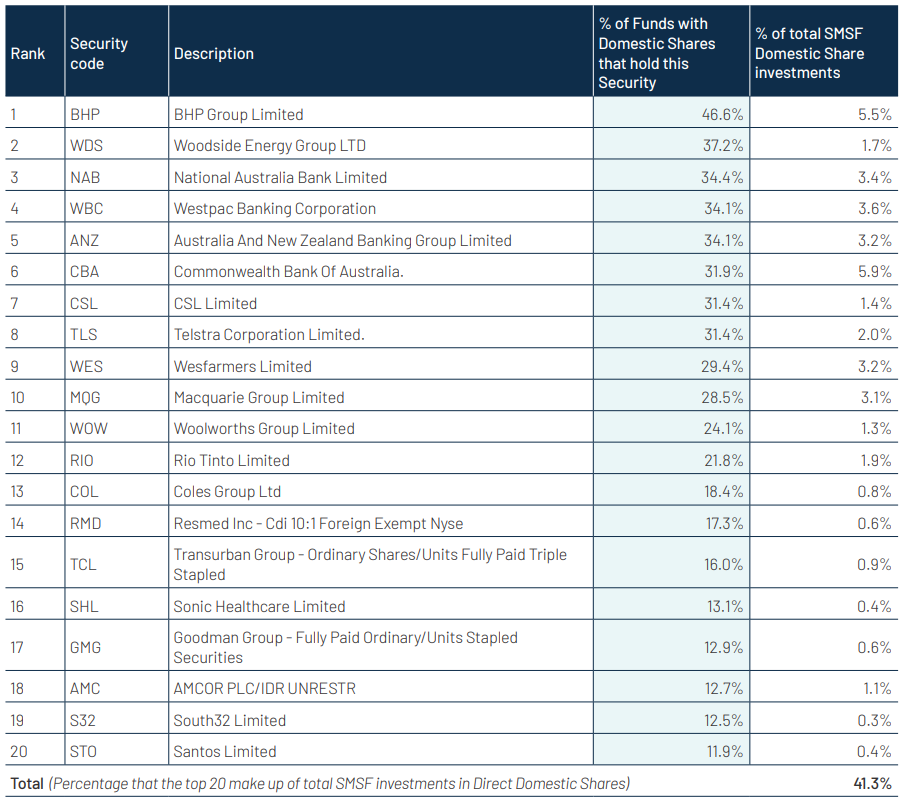
On the ASX side, the old guard firmly maintains control of many SMSF portfolios. BHP and Woodside remain the two most widely held Australian shares but what's perhaps more interesting is that their popularity is declining. Both fell from FY25, when BHP was held by 49.0% and Woodside by 41.8%.
Notably, Amcor returned to the top 20 in FY26, ranking 18th and held by 12.7% of funds with direct domestic shares, while Endeavour Group dropped out.
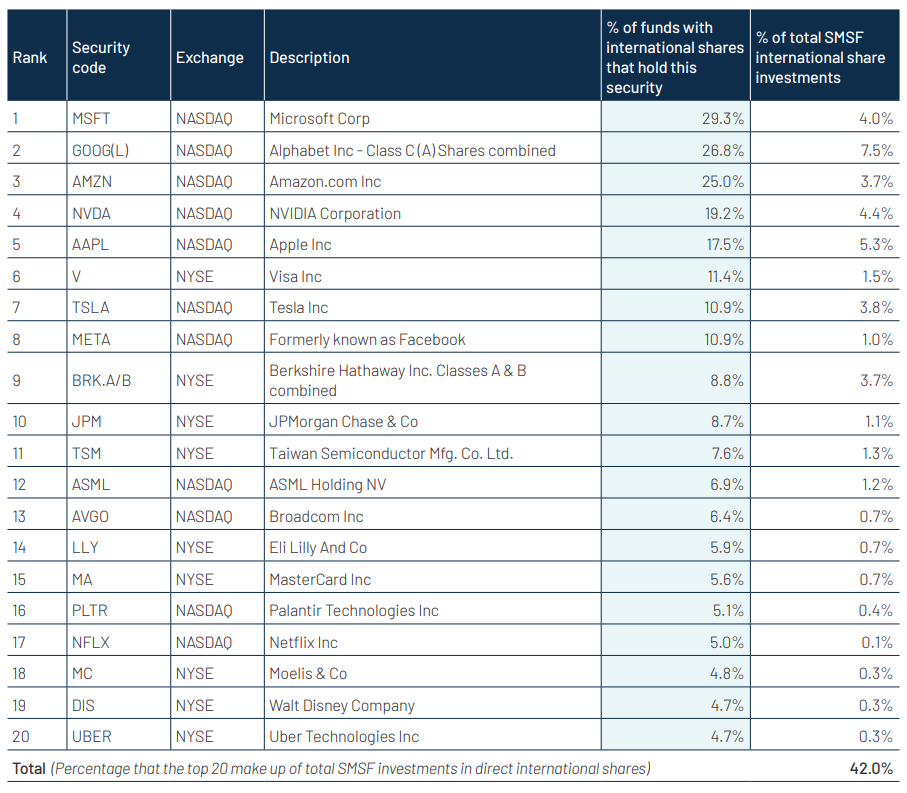
On direct international shares, the technology behemoths continued to dominate. The top three were unchanged from the previous year - Microsoft (29.3%) remaining the most popular holding, followed by Alphabet (26.8%) and Amazon (25.0%).
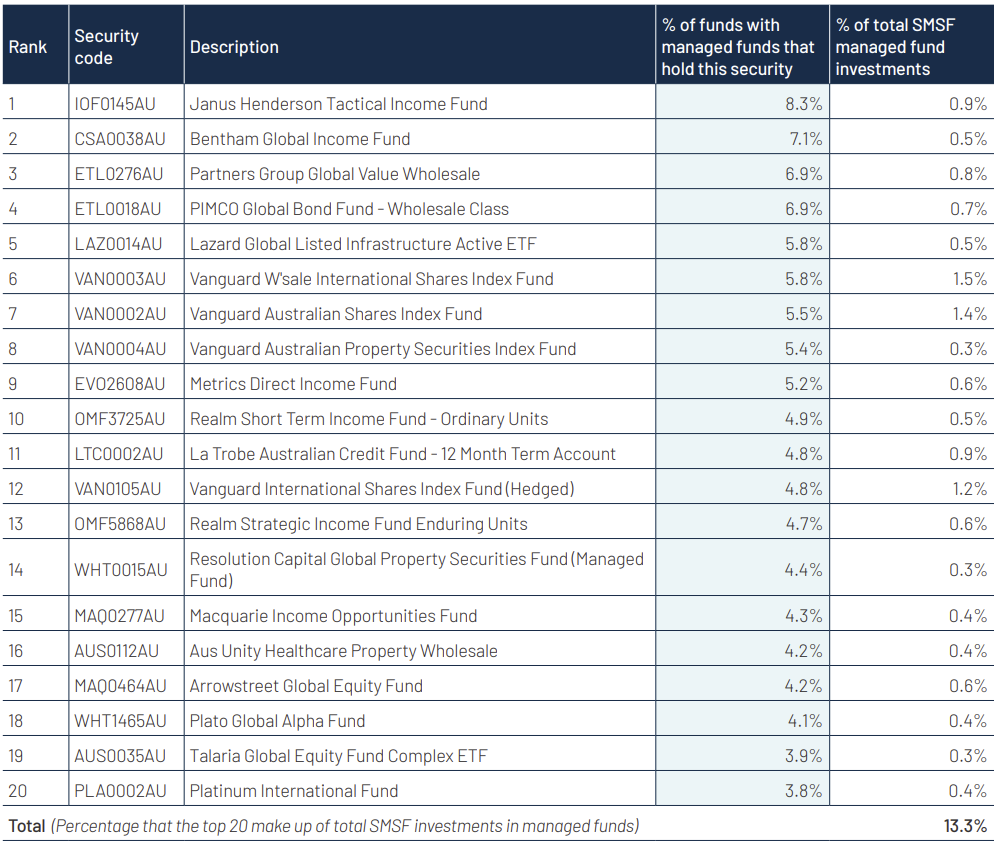
One notable feature of the data is the composition of popular managed funds. Income-focused funds continue to dominate rankings where the Janus Henderson Tactical Income Fund retained the top spot (8.3%), while Bentham Global Income Fund moved from fourth to second, held by 7.1% of funds.
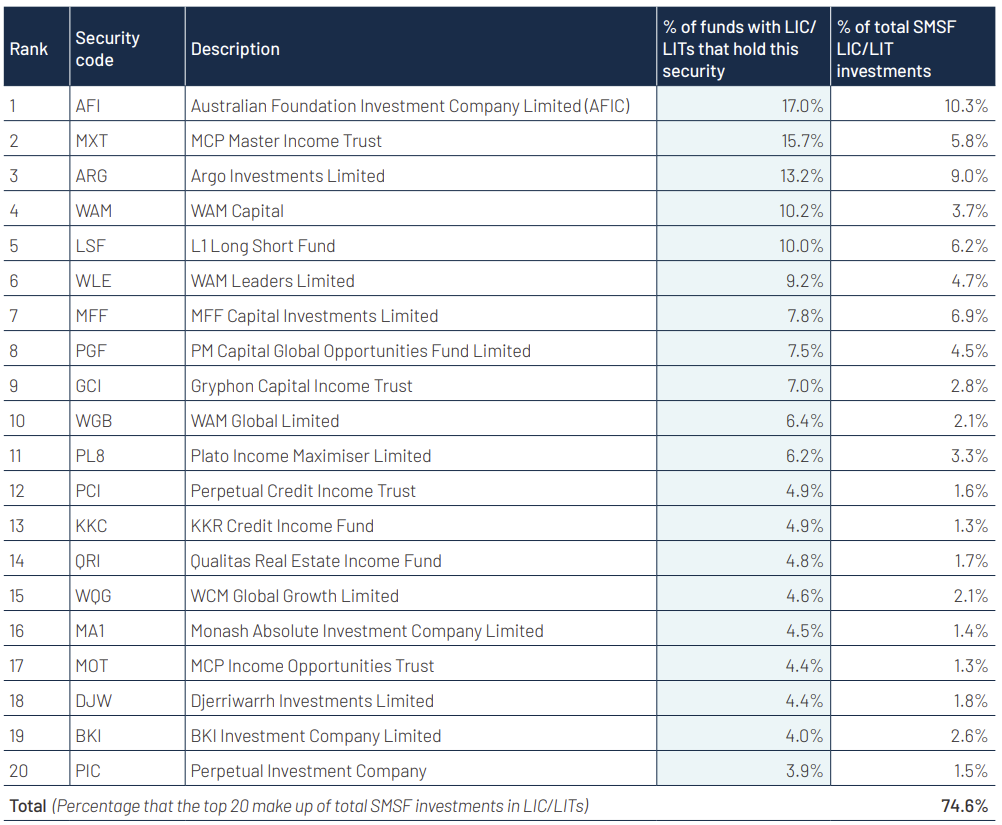
The most popular LICs generally stayed consistent in FY26, though AFIC, Metrics, ARGO and Wilson Asset Management saw some mild attrition.
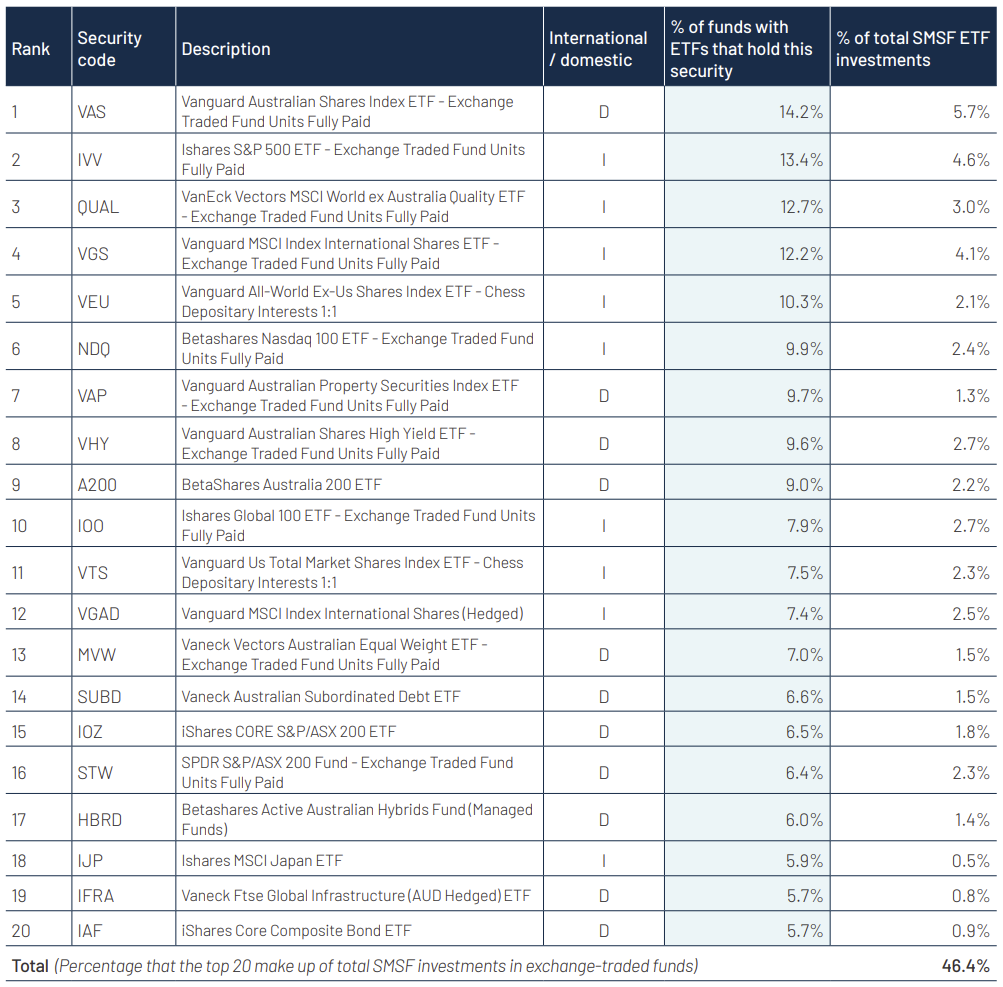
Lastly, the conversation wouldn't be finished without a mention of ETFs, which continued to gain popularity among Class SMSFs with 36% holding at least one in FY26. Vanguard endured as the largest ETF provider by market value, followed by Betashares, BlackRock and VanEck. Together, these four providers accounted for 81% of ETF assets held by Class SMSFs.
Six of the 10 most popular ETFs in FY26 provided international exposure. Vanguard's Australian Shares Index ETF continued to hold top spot, meanwhile VanEck's MSCI Index International Quality ETF (QUAL) was dethroned from second place by the iShares S&P 500 ETF.
Simonelle Mody
***
Weekend Market Update
From Shane Oliver, AMP
Global share markets were mixed over the last week with US and Eurozone shares down as bond yields rose further, whereas Japanese shares surged helped by expectations that the BoJ won’t speed up the pace of rate hikes. Chinese shares also fell. Australian shares had a volatile ride with a 2% plunge on Thursday but were little changed for the week with no real surprises from the RBA, with falls in resources and bank stocks offsetting gains in IT, retail and telco shares.
Oil prices bounced around above $US100 with Saudi Arabia restoring half the flow through its East West pipeline and ongoing signs of tankers getting through the Strait of Hormuz keeping a lid on prices, but the lack of any deal to decisively reopen the Strait along with reports that the US is considering sending another aircraft carrier and more troops to the Middle East keeping them elevated. The risks on the upside remain high as Iran may be motivated to push oil prices up going in to the midterms to punish Trump and we can’t keep running down global oil reserves indefinitely. Disrupted Russian oil product exports have added to upwards pressure on diesel prices.
The bond vigilantes are back. The past week saw another rise in bond yields. Bonds have been oversold for several weeks now but their continued sell off is a sign of the strength in the bear market that is now engulfing them. As with the Australian housing market they are getting hit by a perfect storm with: high energy prices adding to inflation worries; rising expectations for central bank rate hikes; stronger economic data adding to concerns that maybe the neutral short term rate has moved up; worries about big budget deficits in the US, UK, France and elsewhere; increased corporate borrowing to fund data centre investment; erratic US policy marking; and a rising trend in Japanese bond yields leading to a reversal of the so-called carry trade. And in Europe we are seeing a renewed widening in the bond yield spread between French, Italian, Spanish and Greek bonds on the one hand and German bonds on the other reminiscent of the Eurozone crisis. Put simply bond investors are starting to demand a higher risk premium in order to buy government bonds globally and also in Australia. The US 10-year bond yield briefly rose to its highest since 2002 and Australia’s 10 year bond yield is around its highest since 2011.
From TINA to TARA. The ongoing back up in bond yields has significant consequences for other asset classes. The multi decade super cycle downswing in bond yields from the 1980s drove a “search for yield” that pushed investors out along the risk frontier into corporate debt, equities, commercial property, infrastructure, housing, private credit etc. It culminated in TINA or “There Is No Alternative” where investors put money into shares because bonds and cash paid such low returns. Its reversal this decade after 10-year bond yields bottomed out around 0.5% or sub zero in some cases in 2020 threatens to reverse this – with talk of TARA or “There Are Reasonable Alternatives” - putting downwards pressure on the valuations of other assets as investors demand higher yields from them too.
In the near term this leaves shares vulnerable to a further correction. US shares have held up well and moved through the seasonally weak months of August and September without a major problem. But Eurozone shares are down 5.7% from their August high and Australian shares which are down 6.7% from their August high. The risk of a deeper correction in shares remains high. Along with the back up in bond yields at a time when equity risk premiums are low, the worry list for shares remains high and includes: the likelihood of more central bank rate hikes; the ongoing oil supply shock; worries about an AI bubble; and political uncertainty ahead of the US midterms with a Democrat win potentially flagging the risk of US tax hikes and Trump possibly ramping up tariffs and the Iran War once the midterms are over as he becomes a lame duck president.
In Australia, the RBA provided no surprises with a hawkish hike taking the cash rate to a 15 year high of 4.6%. Put simply upside risks to its inflation forecasts – flowing from excess demand but made worse by higher energy prices and booming AI data centre investment - materialised so it hiked rates again as it indicated it would. Failure to have done so would have risked a further loss of confidence in its commitment to the 2-3% inflation target. As expected, and as necessary with underlying inflation well above target and having been so for five of the last six years, it remains hawkish warning that it will raise rates again if needed.
Our base case is that rates have probably peaked as the RBA has likely done enough to weaken demand sufficiently to push inflation back to target by the end of next year – but expect the RBA to remain hawkish for a while yet with no rate cut until late next year. Mortgage interest payments as a share of household income are now pushing back to around the highs reached in 2024 which when combined with higher petrol bills will act as a big constraint on consumer spending, falling home prices will drive an increasing negative wealth effect on consumer spending, household spending in August showed signs of starting to slow, unemployment is continuing to drift higher, the NAB survey shows business conditions at their weakest since the pandemic and home building approvals are now starting to trend down pointing to less home building. And while underlying or trimmed mean inflation remained at 3.6%yoy it was fractionally less bad than feared and didn’t add any further to the upside risks on inflation that the RBA responded to with its September hike. So, while another hike is a very high risk for November, by the time we get to the next RBA meeting there is likely to be enough evidence of cooling demand in the economy to enable the RBA to leave rates on hold and return to “wait and assess” mode, albeit with an ongoing tightening bias and this to remain the case going into next year. But while our base case is that rates have peaked, we don’t see the RBA being able to start cutting until late next year. So, expect a long hold at current high rates with constant concern that rates may still go higher. At present the money market sees a 28% chance of a November high (which is probably a bit too low), but still sees one or two more hikes ahead (which is probably a bit too pessimistic).
Australian inflation rose to 4%yoy in August with a 15% rise in auto fuel prices with trimmed mean inflation holding at 3.6%yoy – both were fractionally better than expected but don’t really change the outlook. September quarter trimmed mean inflation looks on track to come in around 1%qoq or 3.6%yoy, which is above the RBA’s August forecast for a 3.5%yoy rise but the RBA looks to have already adjusted to that with its September rate hike.
The RBA’s latest Financial Stability Review characterised the Australian financial system as remaining resilient with most household and business borrowers likely to be able to manage through slower growth and falling home prices. In particular, the FSR notes that housing and business loan arrears are low, the proportion of home borrowers with a cash flow shortfall is likely to remain low based on RBA assumptions from August and even with a 20% fall in home prices only around 5% of mortgages would fall into negative equity, and it suggests banks should be able to absorb a 20% fall in home prices because of strong capital reserves. So, in short, the RBA does not see a major threat to financial stability from domestic risks. Rather it sees more risks from external factors like high levels of public debt in some countries and low risk premia associated with optimism about AI. Of course, saying that financial stability risks are low from domestic sources does not mean that the economy is not vulnerable to rate hikes and falling home prices and while “most” households and businesses are in good shape the problems could still be significant for “some” and this can often have a significant impact on the wider economy. So, the RBA still needs to be cautious not to raise rates too far.
Also in this week's edition...
After a high-profile dividend cut and a prominent fund manager’s apology, David Tuckwell argues why he thinks the LIC structure needs to die.
Elyse Dwyer and Nick Garvin model two decades of housing data to determine the winners and losers of the new housing tax reforms.
Proposed trust tax reforms could force families to rethink estate planning. Felipe Araujo details three things to consider before making any changes.
Neil Rogan examines why the biggest investment risk is often disguised as research and sensible risk management.
Active managers largely fell short in 2026 despite the odds stacked in their favour. Russel Chesler explores an alternative strategy that has continued to make its case.
Despite a sharp fall in equity valuations in the past year, investors have largely been spared. Amr Hanafy and Jeff Blazek propose five key drivers behind this.
We worry about AI becoming conscious. But what if consciousness isn't the issue? Tony Dillion asks the question on everyone's mind - has AI gone rogue?
Curated by Simonelle Mody and Leisa Bell
A full PDF version of this week’s newsletter articles will be loaded into this editorial on our website by midday.
Latest updates
*** We have had numerous readers ask what has happened to the ASX Listed Bond and Hybrid Rate Sheet that was published each week. Unfortunately, the NAB Markets team recently decided to discontinue its production, so we can no longer make it available to you. Instead, you might like to access the monthly bond and hybrid reports or prices pages that are published by the ASX (links can be accessed via our Education Centre section). ***
PDF version of Firstlinks Newsletter
LIC (LMI) Monthly Review from Independent Investment Research
Listed Investment Company (LIC) Indicative NTA Report from Bell Potter
Plus updates and announcements on the Sponsor Noticeboard on our website