Register For Our Mailing List

Register to receive our free weekly newsletter including editorials.

Home / 341

Where do Australian share returns come from?

Last month, we looked at how Australian shares performed in the last decade in terms of the winners (healthcare, tech, utilities) and losers (miners, oil/gas, telcos, banks). This time we look at how Australian shares fared in relation to other asset classes in diversified portfolios.

Then we break down the underlying components of the performance of Australian shares, and see what they suggest for the future.

Australian equities versus other assets

Australian shares had a relatively poor decade in the 2010s, with total returns (share price gains plus dividends) of 8% per year. This is below the long-term average of around 11% per year. The 8% was lower than 12% per year from international shares and Australian listed property trusts. Coming in at 6% per year were Australian and international bonds, but with much lower volatility than shares.

Here are the total returns from the major asset classes (in Australian dollars) for each of the past 10 years, and the decade averages at right.

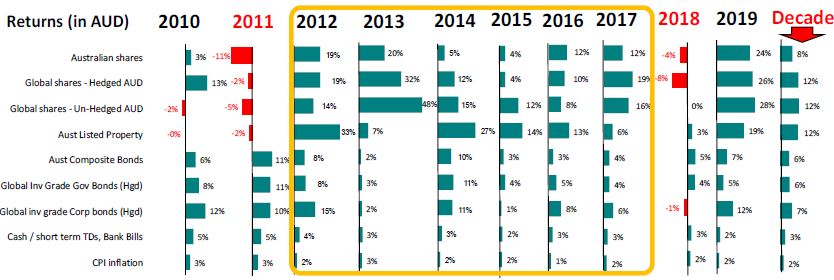
It would have been reasonable to expect that returns from shares would be relatively good in the 2010s because the decade started out from a low base after the share price crash in 2008 and the partial rebound in 2009, but it was not to be. 2010 was a continuation of the 2009 rebound, but Australian shares were hurt by four rate hikes by the RBA due to rising inflation in the China-led commodities surge.

Then came the great ‘QE’ boom (quantitative easing: central banks buying assets with newly printed money to force down interest rates in order to entice people to buy shares – which they did!). The result was a six-year run of positive real (after inflation) returns from all main asset classes.

This had never happened before and will probably never happen again. 

But in 2017, we saw three Fed rate hikes and the European Central Bank talked about closing its QE programme. It was the end of the great six-year golden era for returns. In 2018 share prices fell everywhere and bonds also posted low returns - an unusual combination. The triggers included rate hikes from the US plus slowdown fears in China, stagnation in Europe and Japan, fears of slowing growth in the US and Trump started his trade wars. As these worries eased, market strength returned in 2019.

There are also useful lessons in seeing where the returns from Australian shares actually come from. 

Where do share returns come from? 

The broad Australian share market has generated total returns (share price gains plus dividends, but before tax and franking credits) averaging 11.3% per year since 1980. It is tempting to simply assume that because the market has generated these good returns for such a long period, then it would be reasonable to expect this to continue over the next 10 years or so.

This is too simplistic. We need to understand the different sources of returns, and then to assess whether each of the components is likely to continue in future at the same rate, or higher, or lower, or maybe even reverse direction.

The chart below shows the sources of returns by decade since 1960 (columns A to F). Column G shows the average since 1960. H is since 1980, which breaks up the 11.3% from the prior chart. Column J shows the most recent 10 years (which in this edition is the same as the 2010s decade, column F), and K shows a forecast for the next 10 years. The bottom section shows average annual total returns in each period.

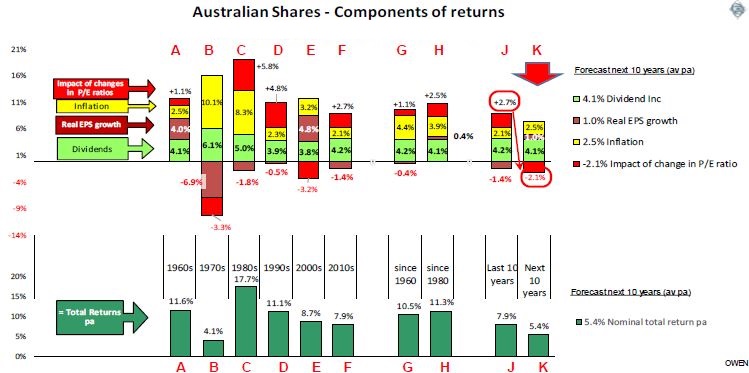
The first observation is that not only do the total returns to shareholders vary significantly in each decade, the sources differ even more.

Total shareholder returns over the past 10 years averaged 7.9% pa (column J), which is lower than post-1980 average of 11.3% (H). The main reason was that inflation (yellow bars) was lower over the past decade than it was since 1980.

These returns came from the following four sources:

  1. Dividends contributed 4.1% pa since 1980 and 4.2% pa over the past decade. This is the only component of returns that is likely to be sustainable at similar levels in the next 10 years (and is the only component that has been reasonably consistent over the prior century as well).
  2. Inflation contributed 3.9% pa since 1980 but only 2.1% over the past decade. Inflation over the next decade will probably average say 2.5%.
  3. Growth in real (ie excluding inflation) earnings (profits) per share contributed only +0.4% pa since 1980 and a negative -1.4% per year for the past decade. This is a very poor indictment of management of Australian companies over the past 40 years – to consistently fail to grow real profits per share even though the total economic pie in Australia has been growing by more than 3% per year (real GDP growth).
  4. Changes in price/earnings ratios are changes in the amount of money investors are willing to pay per dollar of profits. This contributed another +2.5% per year since 1980 and +2.7% per year over the past decade. Price/earnings ratios were 7.5 at the start of 1980, and 15.2 at the start of the last decade, but the ratio is 19.8 now. This means that investors paid $15.20 per dollar of company profits at the start of 2010 but they are willing to pay $19.80 per dollar now, which pushed share prices up by 30% (or 2.7% pa) for the same level of profits. People feel richer when they look at their share prices, but it is an illusion. They simply paid 30% more for the same profits than they did 10 years ago.

For this illusory price gain to continue, we would have to pay another 30% more per dollar of profits in the next 10 years, which would push the ratio up to an even more expensive 26 times profits. Even if the ratio stayed flat at the current expensive 19.8, it would mean returns will be 2.7% lower than last decade.

A more realistic assumption would be that the current 19.6 price/earnings ratio is unsustainably high and would probably fall back to say 16 (still above the historical average of 14). This would reduce returns by another 2% per year.

And so to the forecast

If we assume dividends at around 4%, plus inflation of around 2% to 2.5%, plus real earnings per share growth of say 1% or perhaps 2% pa (since we are now in a profit slump), we get 7-8% total returns IF price earnings ratios remain flat, which is highly unlikely.

If price earnings ratios reduce back to 16, that knocks 2% off returns, to say 5-6% pa. This is a sobering prospect, but it forces us to look at how returns are generated rather than simply relying on history to repeat. It rarely does.


Ashley Owen is Chief Investment Officer at advisory firm Stanford Brown and The Lunar Group. He is also a Director of Third Link Investment Managers, a fund that supports Australian charities. This article is for general information purposes only and does not consider the circumstances of any individual.


7 Comments
Tim Farrelly
January 27, 2020

Hi SMSF Trustee
I am not sure this is correct.
The after tax impact of imputation is different for different taxpayers but the same applies for dividends and capital growth. On a pre-tax basis a dollar in imputation credits is worth a dollar of dividends to all tax payers. Given that all other returns are quoted pre-tax, including imputation does give a more accurate assessment when comparing across markets.

SMSF Trustee
January 27, 2020

Tim Farrelly,

actually, that's a good point. I was thinking about comparing after-tax returns and responding to the original question by noting that these are going to be different so you'd need a bunch of different return tables.

But in terms of the pre-tax return, you're right. Dividends paid plus imputation credits are part of the pre-tax result. Accumulation indices don't, as far as I'm aware, take these into account.

Adrian
January 23, 2020

Thanks for this. I like the components of return, which were also used a lot by Bogle. Just a caution, the forecast pe derating back to 16 May take off 2% p.a. over a decade, but it will likely occur as a 20-25% correction in a single year. Most investors would not care too much about the former but the latter is somehow much harder to contemplate and to manage without taking actions that further dent returns.

AG
January 23, 2020

Where have you included share buybacks in this?

Graham Bull
January 22, 2020

What about imputation credits? To compare Australian shares with other assets you should use gross dividend yield.

SMSF Trustee
January 22, 2020

Graham, you can't do that because the impact is different for investors at different tax rates. For most individual Australian equity holders, who are on the top marginal tax bracket, their after-tax return includes dividend minus 49% tax, while for retirees on zero tax it's dividend plus 30% franking credit.

The asset allocation implications of our imputation system are different for different investors, depending on their tax rate. Charities and retirees have a greater incentive to overweight Australian shares, but this doesn't exist for average tax payers and those on the higher tax bracket.

George
January 22, 2020

As well as not sharing in the market highs, retirees generally own the telstras and banks of the world which have not delivered like the techies.


Leave a Comment:


RELATED ARTICLES

Only 2.4% of companies deliver all net shareholder wealth

Spotting signs of trouble in a retirement portfolio

10 years on from the GFC, retirees still jittery

banner

Most viewed in recent weeks

2024/25 super thresholds – key changes and implications

The ATO has released all the superannuation rates and thresholds that will apply from 1 July 2024. Here's what’s changing and what’s not, and some key considerations and opportunities in the lead up to 30 June and beyond.

The greatest investor you’ve never heard of

Jim Simons has achieved breathtaking returns of 62% p.a. over 33 years, a track record like no other, yet he remains little known to the public. Here’s how he’s done it, and the lessons that can be applied to our own investing.

Five months on from cancer diagnosis

Life has radically shifted with my brain cancer, and I don’t know if it will ever be the same again. After decades of writing and a dozen years with Firstlinks, I still want to contribute, but exactly how and when I do that is unclear.

Is Australia ready for its population growth over the next decade?

Australia will have 3.7 million more people in a decade's time, though the growth won't be evenly distributed. Over 85s will see the fastest growth, while the number of younger people will barely rise. 

Welcome to Firstlinks Edition 552 with weekend update

Being rich is having a high-paying job and accumulating fancy houses and cars, while being wealthy is owning assets that provide passive income, as well as freedom and flexibility. Knowing the difference can reframe your life.

  • 21 March 2024

Why LICs may be close to bottoming

Investor disgust, consolidation, de-listings, price discounts, activist investors entering - it’s what typically happens at business cycle troughs, and it’s happening to LICs now. That may present a potential opportunity.

Latest Updates

Shares

20 US stocks to buy and hold forever

Recently, I compiled a list of ASX stocks that you could buy and hold forever. Here’s a follow-up list of US stocks that you could own indefinitely, including well-known names like Microsoft, as well as lesser-known gems.

The public servants demanding $3m super tax exemption

The $3 million super tax will capture retired, and soon to retire, public servants and politicians who are members of defined benefit superannuation schemes. Lobbying efforts for exemptions to the tax are intensifying.

Property

Baby Boomer housing needs

Baby boomers will account for a third of population growth between 2024 and 2029, making this generation the biggest age-related growth sector over this period. They will shape the housing market with their unique preferences.

SMSF strategies

Meg on SMSFs: When the first member of a couple dies

The surviving spouse has a lot to think about when a member of an SMSF dies. While it pays to understand the options quickly, often they’re best served by moving a little more slowly before making final decisions.

Shares

Small caps are compelling but not for the reasons you might think...

Your author prematurely advocated investing in small caps almost 12 months ago. Since then, the investment landscape has changed, and there are even more reasons to believe small caps are likely to outperform going forward.

Taxation

The mixed fortunes of tax reform in Australia, part 2

Since Federation, reforms to our tax system have proven difficult. Yet they're too important to leave in the too-hard basket, and here's a look at the key ingredients that make a tax reform exercise work, or not.

Investment strategies

8 ways that AI will impact how we invest

AI is affecting ever expanding fields of human activity, and the way we invest is no exception. Here's how investors, advisors and investment managers can better prepare to manage the opportunities and risks that come with AI.

Sponsors

Alliances

© 2024 Morningstar, Inc. All rights reserved.

Disclaimer
The data, research and opinions provided here are for information purposes; are not an offer to buy or sell a security; and are not warranted to be correct, complete or accurate. Morningstar, its affiliates, and third-party content providers are not responsible for any investment decisions, damages or losses resulting from, or related to, the data and analyses or their use. To the extent any content is general advice, it has been prepared for clients of Morningstar Australasia Pty Ltd (ABN: 95 090 665 544, AFSL: 240892), without reference to your financial objectives, situation or needs. For more information refer to our Financial Services Guide. You should consider the advice in light of these matters and if applicable, the relevant Product Disclosure Statement before making any decision to invest. Past performance does not necessarily indicate a financial product’s future performance. To obtain advice tailored to your situation, contact a professional financial adviser. Articles are current as at date of publication.
This website contains information and opinions provided by third parties. Inclusion of this information does not necessarily represent Morningstar’s positions, strategies or opinions and should not be considered an endorsement by Morningstar.