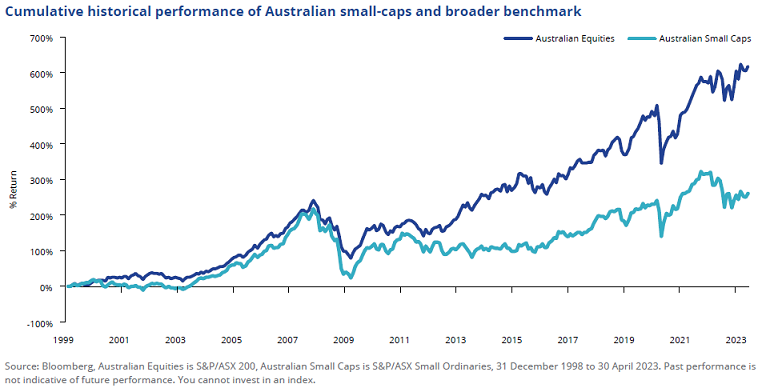
An anomaly an Australian investor must contend with is that the alpha evident elsewhere in the world is not evident in local small-cap indices. The S&P/ASX Small Ordinaries Index has delivered lower cumulative returns relative to the broader Australian equities benchmark since 1998.
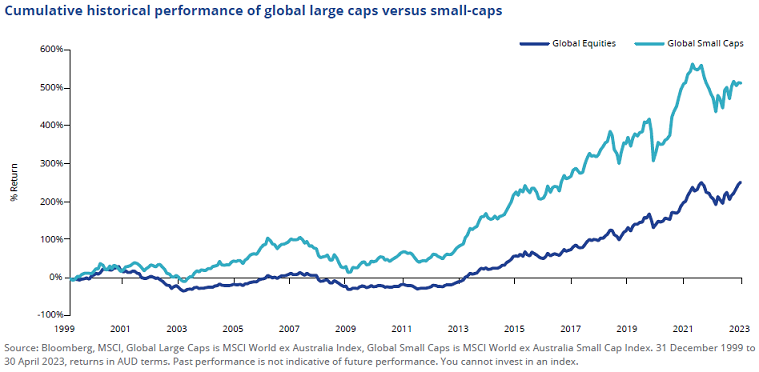
Unlike Australian small companies, global smaller caps have historically demonstrated outperformance relative to large companies over the long term. Below is the cumulative performance of MSCI World ex Australia versus MSCI World ex Australia Small Cap indices.
Australian small-cap conundrum
The Australian small-cap universe is hamstrung by structural nuances, not present globally.
1. Market size
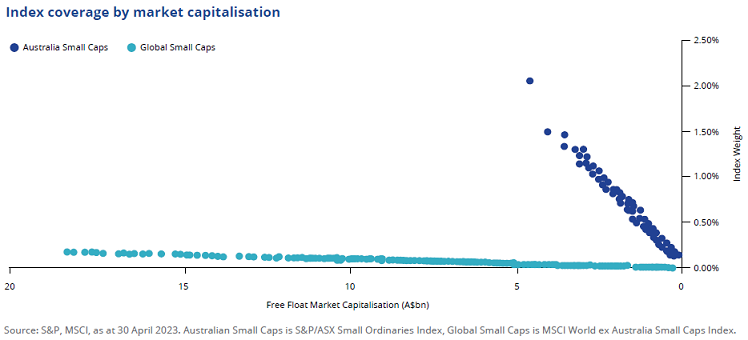
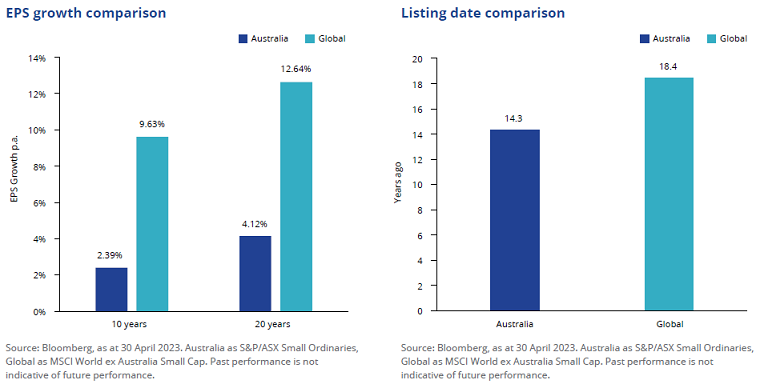
An observation that might surprise Australian investors is that the global small-caps, in the context of market size, would be characterised as mid-caps in Australia when measured by market capitalisation. Global small-caps are, on average, two times larger than Australian small-caps, as represented by MSCI World Small Cap and S&P/ ASX Small Ordinaries. Furthermore, the largest global small-cap, in the context of Australian listed companies by market capitalisation, would rank as approximately the 20th largest on ASX, 80 places ahead of the largest Australian small-cap determined by the S&P/ASX Small Ordinaries Index (stock 101).
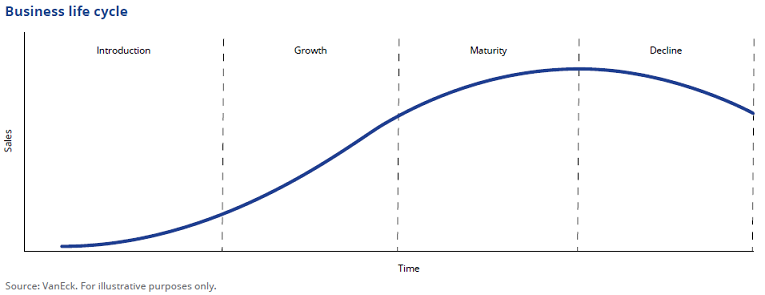
Higher average market capitalisation of global small-caps relative to Australia small-caps implies that these companies are more established businesses in the ‘growth’ phrase of the business cycle. They have grown to a size to be included in the MSCI World ex Australia Small Cap market coverage range by demonstrating an increase in sales and earnings growth. Australian small-caps by comparison have a higher proportion of companies in the ‘introduction’ phase, meaning that sales and earnings growth are likely to be more mixed, with a shorter track record.
This observation is reflected when comparing earnings per share (EPS) growth of small-cap benchmarks over the past 10 and 20 years. Global EPS growth outpaced Australia by more than three times. Average time since listing of global small-caps is also four years longer than Australian small-caps.
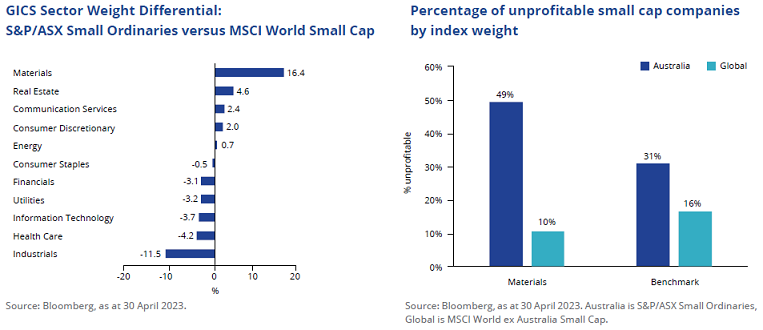
2. Unprofitable company coverage
The largest Australian small-cap sector is materials. In the global index, it is one of the smallest sectors. Many small unprofitable mining companies list on the Australian stock exchange in the ‘infant’ stage of the business cycle to raise capital for exploration or mine development where debt and private equity financing is unavailable. This is less common globally as offshore exchanges have stricter rules around profitability and financial viability requirements for listing1. This means that exposure to an Australian small-cap strategy may not be a sound investment approach. Australian small-caps have almost double the exposure to non-profitable companies, compared to global.
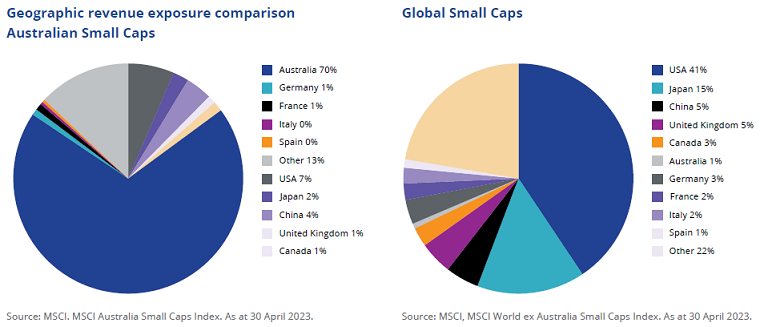
3. Geographic revenue exposure
Australia accounts for 1.7% of global gross domestic product (GDP) and 0.3% of the world’s population. If you exclude mining companies, Australian small-caps tend to be Australian centric operations with low global revenue. Primarily servicing Australian customers limits scope for expansion, unless the company goes through a capital raising to expand operations globally, often resulting in the company dropping from S&P/ASX Small Ordinaries coverage. However, global small-caps are more likely to have global operations, or, if they are only locally based offer the potential for significant market expansion by servicing countries that are larger by GDP.
Australia accounts for 1% of global small-cap revenue compared to 70% locally. Williams-Sonoma, Inc is a good example of a US small-cap that operates globally. The company is an American publicly traded consumer retail company that sells kitchenware and home furnishings, operating approximately 600 brick and mortar stores and distributes to more than 60 countries. Listed in 1983 and has a market capitalisation of A$11.9 billion [As at 31 March 2023].
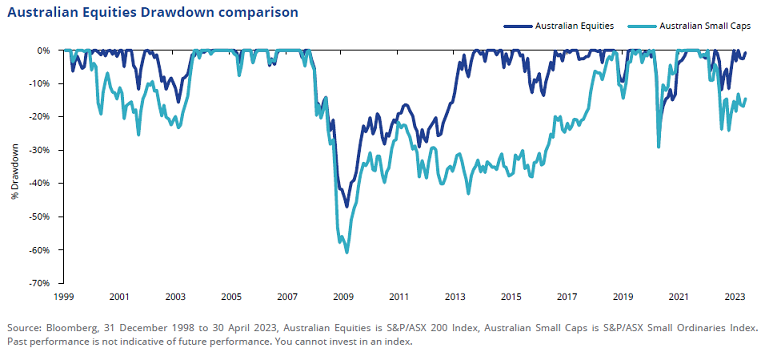
Drawdown
Adding small-cap exposure to large- and mid-cap exposures in portfolios is known to increase the risk of losses. This is true globally with small-caps historically having slightly larger drawdowns during the global financial crisis (GFC) and COVID-19 market shocks. However, it is also worth noting that global small-caps returned to pre-shock highs faster following the GFC and 2001 dot com bubble. Noting, this should not be relied upon as an indicator of future performance.
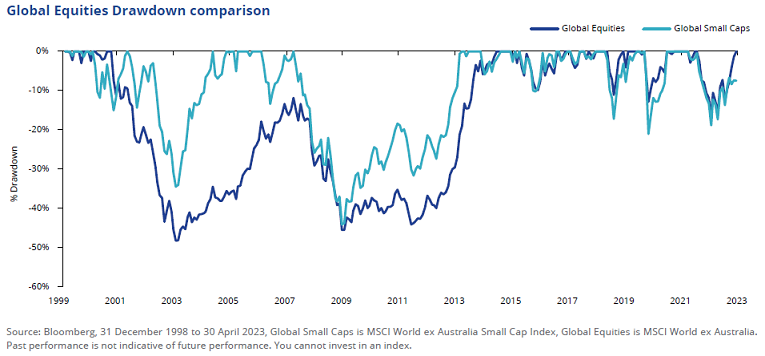
In Australia, small-caps drawdown was materially worse than large caps during the dot com, global financial crisis and COVID-19 market shocks. This is in line with expectations as investors typically seek large companies during market stress events as their business models are seen to be more viable during economic downturns. The higher dispersion in the scale of the drawdown between small- and large-caps is a function of the market size of Australian small-caps relative to global.
Access to global small cap equities
Global small-cap investing has been an effective way to achieve excess returns relative to large and mid-caps over the long term. It is supported by modern portfolio theory, academics and illustrated through empirical research. However, when small-cap investment strategies are applied in Australian equities, they fail to achieve excess returns for three reasons: size, exchange listing requirements and sector exposure.
1 ASX listing rules profit test – A$1 million aggregated profit from continuing operations over past 3 years + A$500,000 consolidated profit from continuing operations over the last 12 months. NYSE listing profit rules - US$10 million aggregated profit from continuing operations for last 3 years.
Cameron McCormack is a Portfolio Manager at VanEck Investments Limited, a sponsor of Firstlinks. This is general information only and does not take into account any person’s financial objectives, situation or needs. Any views expressed are opinions of the author at the time of writing and is not a recommendation to act.
The VanEck MSCI International Small Companies Quality ETF (ASX:QSML) launched in March 2021 and is a passive strategy that tracks the MSCI World ex Australia Small Cap Quality 150 Index. Since March 2021 many investors have benefited from using QSML as the core of their global small cap equities exposure.
For more articles and papers from VanEck, click here.