Most Australians hold their superannuation in funds selected by their employer. Although the default process faces criticisms and members are generally disengaged, it produces excellent results.
For the first time ever, according to Chant West, institutional super funds delivered a 10th consecutive positive financial year return, with the median growth fund up 7% last financial year. Growth funds have a 61% to 80% allocation to growth assets, although there is some debate about the accuracy of this categorisation. The average return over 10 years has been a healthy 8.8% pa. The funds are unlikely to achieve anywhere near that level in the next decade.
No one way to produce the best results
Surprisingly, the top two funds over one year, QSuper and UniSuper, manage vastly different portfolios, and they are both in the top few over a more meaningful 10 years, as shown below. Chant West’s Senior Investment Manager, Mano Mohankumar, said:
“QSuper, like most not-for profit funds, has a meaningful allocation to unlisted assets such as property, infrastructure and private equity. However, where its strategy is unique is that it further smooths out returns for members by investing significantly less in listed shares than other funds. Against that, it maintains a significant allocation to long duration bonds which carry sharemarket-like risk but are a better diversifier against sharemarket falls than traditional bonds.
UniSuper, in contrast, has a strong focus on listed assets. Unlike most other not-for-profit funds, it has very little invested in unlisted assets. Instead, it prefers to gain its exposure to property and infrastructure by taking large stakes in high quality listed companies. UniSuper believes that taking this listed market route has enabled it to be opportunistic in building a portfolio of higher quality property and infrastructure assets at attractive prices.”
It is estimated that 93% of Unisuper’s assets are listed securities available to anybody. How did your portfolio perform relative to these large funds? (results are net of investment management fees).
Top 10 performing growth funds, one year to 30 June 2019 (%)
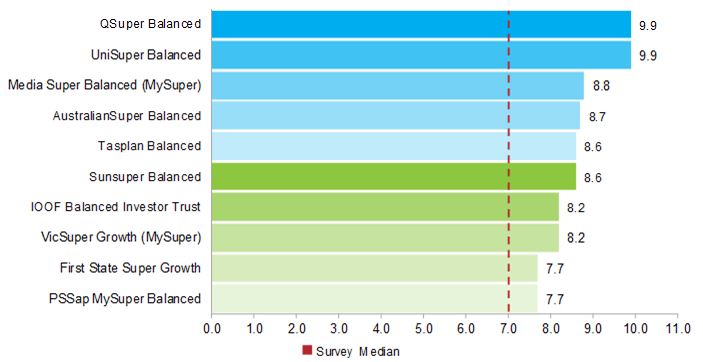
Source: Chant West, red line is survey median.
Top 10 performing growth funds, 10 years to 30 June 2019 (%)
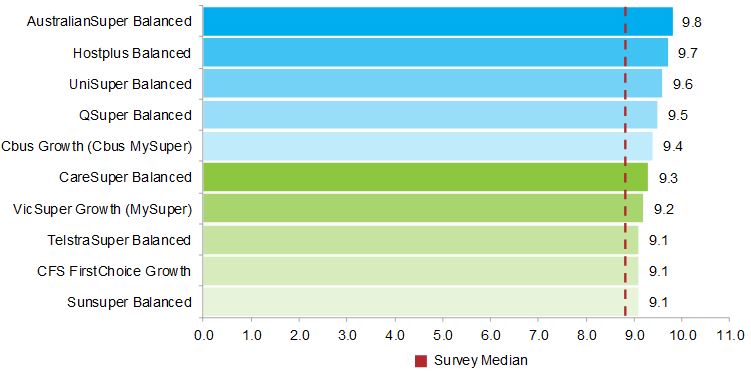
Source: Chant West, red line is survey median.
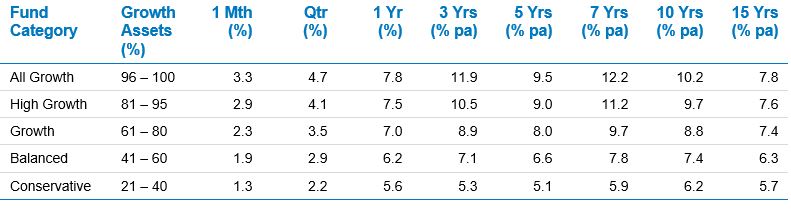
The table below shows performance by fund category. While 2% makes a material difference in a superannuation balance over 15 years, the ‘All Growth’ fund long-term return of 7.8% is only 2% higher than the conservative fund, although the latter’s result is aided significantly by falling bond yields.
Diversified fund performance to 30 June 2019
In the last 27 years, as shown below, growth funds have delivered negative returns in only three years including the two years of the GFC. The last decade has been wonderful for super fund members, and the long period of strong returns suggests growth rather than defensive is worthwhile over multi-decade investment horizons.
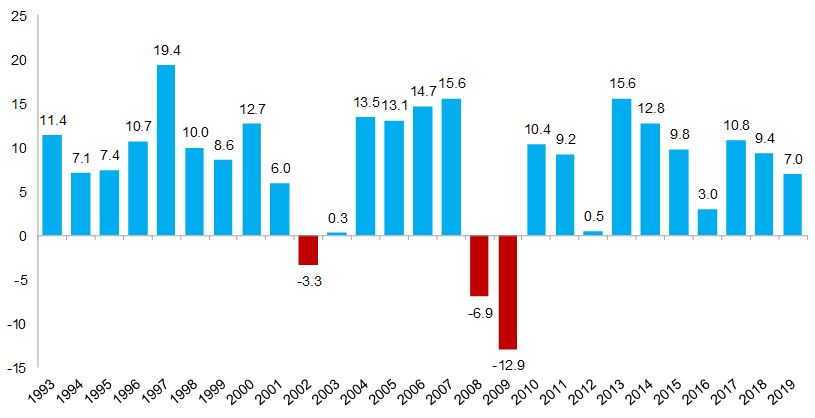
Source: Chant West.
Australian shares managed funds results
Turning to managed fund results as reported by Mercer, the table below compares the Top 10 in Australian shares (ranked according to their one-year results) out to 5 year performance. It is evidence that fund managers should not be judged on short-term numbers. For example, the top fund over one year, the Martin Currie Australian Real Income Fund, was 108th out of 142 over 3 months and 99th out of 121 over 3 years. But its 5 year number was also strong.
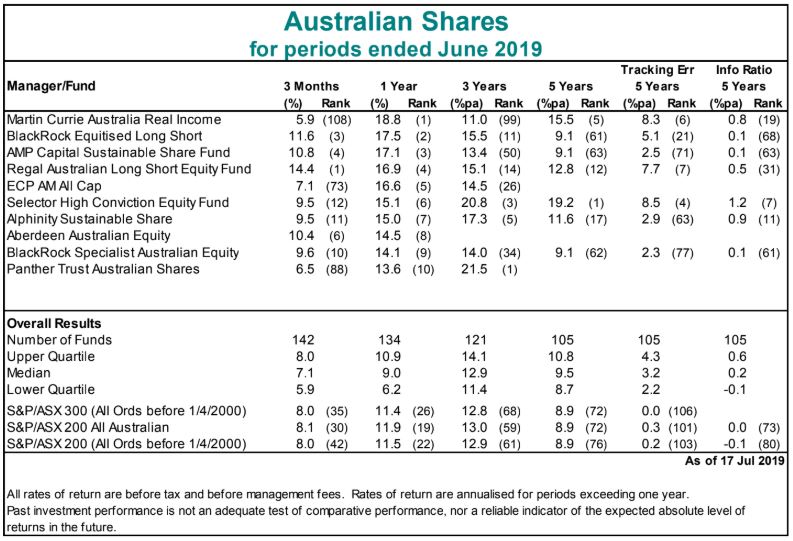
The table also shows:
- In the last year, the median manager (up 9%) has significantly underperformed the S&P/ASX300 index (up 11.4%) but they were much closer over 5 years with the median at 9.5% and the index at 8.9%. However, the results are before management fees so the median manager would struggle to match the index.
- Although a challenge for any investor, picking the top fund manager versus the bottom produces a major result difference. For example, the top fund over 5 years was Selector High Conviction Equity Fund at 19.2% while the bottom quartile delivered only 8.7%. With each quartile holding 26 managers in the 5 year numbers, that’s a lot of talented fund managers delivering poor long-term results.
Graham Hand is Managing Editor of Cuffelinks. This article is general information and does not consider the circumstances of any investor.