Envy of the other 493 stocks in the S&P 500, the so-called Magnificent Seven—including Apple, Alphabet, Amazon, Meta, Microsoft, Nvidia and Tesla—wears extraordinary stripes. In the seven years prior to the Covid-19 pandemic, their collective top line grew at 15% compounded annually, versus just 2% for the rest of the index. Since 2020, the Mag 7 have increased sales by 16% a year.1
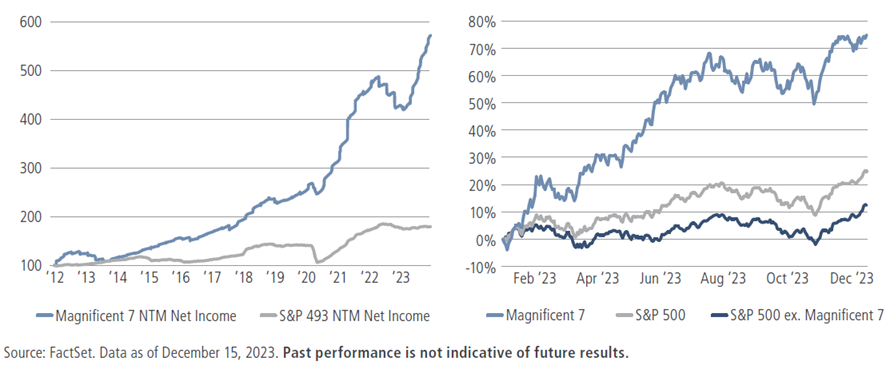
Even in a challenging growth environment, these heavyweights delivered impressively in 2023: The Mag 7’s net income grew 34% versus 1% for the other 493 stocks in the index (see the left side of figure 1), and in a show of investor confidence, their collective P/E multiple expanded 30% compared to 9% for all the rest. As a group, the Mag 7 generated a 75% return for the year versus 25% for the S&P 500; without them, the broader index would have risen just 12% (as shown on the right).
Figure 1: The Magnificent Seven have dominated the other 493 names in the S&P 500 index
Big tech’s influence on sector performance was palpable, too. Without these seven names, the Tech sector would have returned just 15% rather than 50%; the Communication Services sector, 7% versus 50%; and the Consumer Discretionary sector, 6% versus 33%.2
It has wider implications
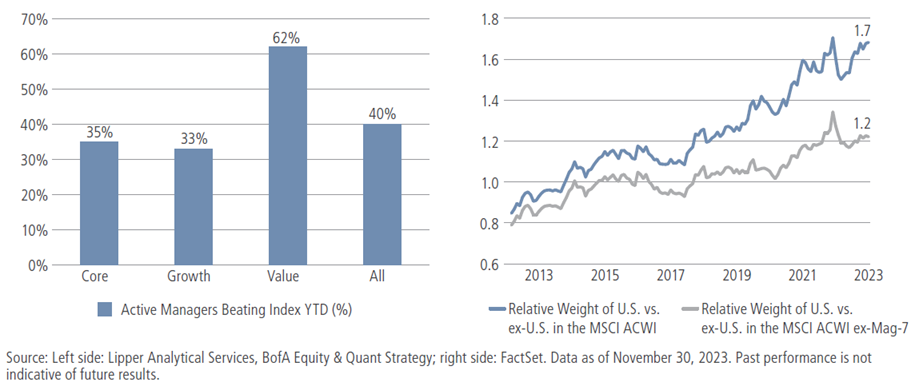
We believe the collective heft of the Mag 7 has even broader implications for investors. The influence of this group—which now comprises nearly half the market-cap weight of the Russell 1000 Growth index and 28% of the S&P 500—has been boldly on display. In 2023, just one-third of U.S. core- and growth-oriented funds outperformed their Mag 7-heavy benchmarks, whereas nearly twice as many value funds outpaced their benchmarks, which don’t include the Mag 7 (see the left chart in figure 2).
The Mag 7’s influence spans geographical borders as well. The weight of U.S. equities in the MSCI ACWI index has risen to an all-time high of 63% from just 46% in 2013. Less appreciated, perhaps, is that fully a third of this increase is due to the rise of the Mag 7! As a result, the U.S. now accounts for 1.7 times the weight of the rest of the world combined; without the Mag 7, the figure is a more modest 1.2 (as shown on the right). Such a reduction in geographical diversification within the index, we believe, could have longer-term implications for asset allocation and risk management.
Figure 2: The collective heft of the Mag 7 has broad risk-management implications
In light of their sheer size and influence, we expect the Mag 7 will continue to shake up active managers’ scorecards relative to their benchmarks in 2024, and beyond.
All the glitters may not keep turning to gold
The Mag 7’s achievements in 2023 notwithstanding, we fear these marquee stocks could face headwinds in the coming year.
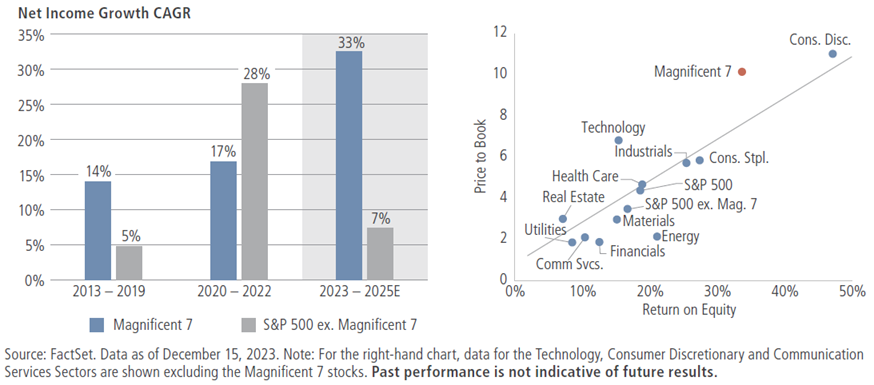
First, valuations appear precarious, in our view. Wall Street expects the Mag 7’s earnings and revenues to grow 33% and 17% per year, respectively, through 2025 (see the left chart in figure 3). Yet even considering the group’s relatively high returns on equity (shown on the right), the Mag 7 has the unnerving distinction of being the largest and most expensive grouping within the S&P 500. At current valuations, we believe this group—which now represents more than a quarter of the S&P 500—is roughly 60% more expensive on a P/E basis than the rest of the index, making them potentially vulnerable to even minor hiccups in the coming year.
Figure 3: The mag 7’s strong earnings expectations are commanding relatively rich valuations
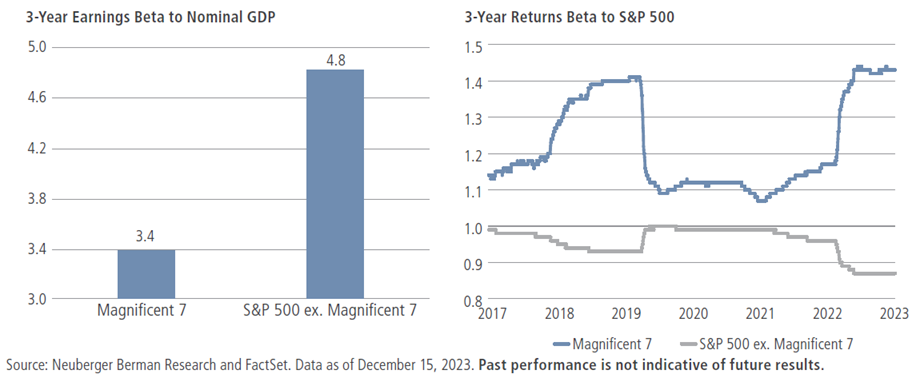
Second, the Mag 7 may prove more cyclical than investors seem to expect. These giants are often considered defensive businesses given that their products drive the relentless modernization of society, and that they also boast strong balance sheets and relatively high, stable profit margins. Indeed, over the last three years, the Mag 7’s earnings beta to nominal GDP has been 30% lower than the rest of the S&P 500 (see the left side of figure 4); however, the price beta of these stocks—at 1.4—was 50% higher than the rest of the S&P 500 (as shown the on right).
Figure 4: The Mag 7 may be less defensive than investors anticipate
Third, we believe the price returns of these seven stocks are highly correlated to each other—meaning that, from a portfolio perspective, owning them as a group is akin to inviting additional risk rather than diversifying away from it. Since 2017, the average pairwise correlation of the Mag 7 has been 55%—that’s 70% higher than for the rest of the 493 stocks.3 Furthermore, we find that correlation tends to rise during selloffs, which could make holding these stocks even riskier in a downturn.
Therefore—and despite some of their defensive characteristics—we fear that investors may have overlooked the inherent cyclicality and correlation of the mega-caps, potentially magnifying the investment risk should the Mag 7 begin to lose favour.
Other things to influence Mag 7's prospects
Looking at these stocks another way—through a factor lens—makes us conclude that overweighting these stocks is essentially a wager on specific factors that have contributed to their outperformance.
One of those factors is international exposure. As shown on the left side of figure 5, the Mag 7 derives roughly half of its revenues from outside the U.S., about twice the percentage for the average U.S. publicly traded company. Adding the Mag 7 to an equity portfolio could increase its sensitivity to international growth—a potential benefit when the global economy is humming, but a potential drag in a broader slowdown.
Figure 5: Specific factor exposures may determine the Mag 7’s outperformance
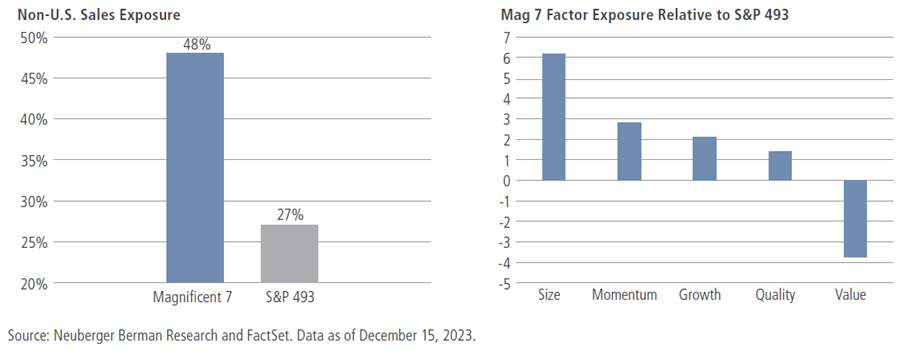
Additional factors may determine the Mag 7’s performance in 2024. Specifically, and relative to the index, the Mag 7 are rich in size, quality, momentum and growth factors, and outperform when these factors are in vogue. As noted in our previous 4Q 2023 Equity Outlook, these factors tend to be rewarded when economic growth slows—as it did in 2023—while being relatively shunned in favour of small size, lower earnings quality and high value when growth eventually rebounds.
1 Source: FactSet. Data as of December 15, 2023
2 Source: Strategus. Data as of December 5, 2023
3 Source: Neuberger Berman Research and FactSet. Data as of December 15, 2023.
Raheel Siddiqui is a Senior Research Analyst, Global Equity Research at Neuberger Berman, a sponsor of Firstlinks. This information discusses general market activity, industry, or sector trends, or other broad-based economic, market or political conditions and should not be construed as research or investment advice. It is not intended to be an offer or the solicitation of an offer.
For more articles and papers from Neuberger Berman, click here.