Register For Our Mailing List

Register to receive our free weekly newsletter including editorials.

Home / 577

Creating a bulletproof investment portfolio

Imagine owning an investment portfolio that could perform in any economic environment. In the deflationary bust of 2008. In the high inflation of the 1970s. In hyperinflation, a la Venezuela. And in the low inflation period of 2009-2021.

It’d be nice, wouldn’t it? Having the reassurance that no matter what is thrown its way, your portfolio would be resilient enough to let you sleep easy at night.

Is it possible to build such a portfolio? There have been various attempts at it, and we’re going to go through three examples of so-called All Weather portfolios today.

Ray Dalio’s portfolio

Hedge fund titan, Ray Dalio, has been pioneer in the field. He’s famous for founding Bridgewater Associates in 1975 and turning it into the US$124 billion giant that it is today.

Dalio is also known as a student of economic cycles. And it was his study of these cycles that led him and his colleagues to try to create a portfolio that could withstand any economic surprise that came its way. They set up the All Weather Fund in 1996, initially to just house Dalio’s trust assets, but eventually to take external money.

As Bridgewater tells the story:

“Market participants might be surprised by inflation shifts or a growth bust and All Weather would chug along, providing attractive, relatively stable returns. The strategy was and is passive; in other words, this was the best portfolio Ray and his close associates could build without any requirement to predict future conditions.”

Dalio knew from his reading of history that no single asset could provide safety at all times; it was only a portfolio of assets that could achieve steady returns under most, if not all, economic conditions.

Dalio’s framework in more detail

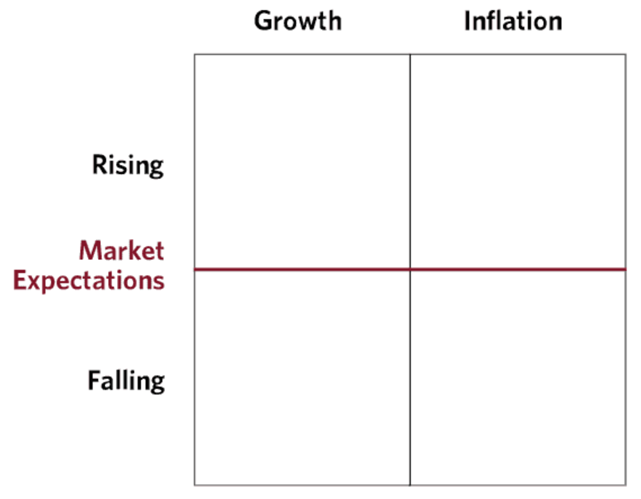
Dalio and Bridgewater broke down economic conditions into four categories:

  • Rising prices (inflation)
  • Falling prices (deflation)
  • Rising growth (bull markets)
  • Falling growth (bear markets)

They put this into the following matrix:

Source: Bridgewater

The question then is which assets are best suited to the different economic environments. Dalio concluded that gold and commodities tend to do well during periods of rising prices, while bonds perform best during periods of falling prices. In times of rising growth, stocks do well, while in declining growth periods, bonds are usually the best asset to hold.
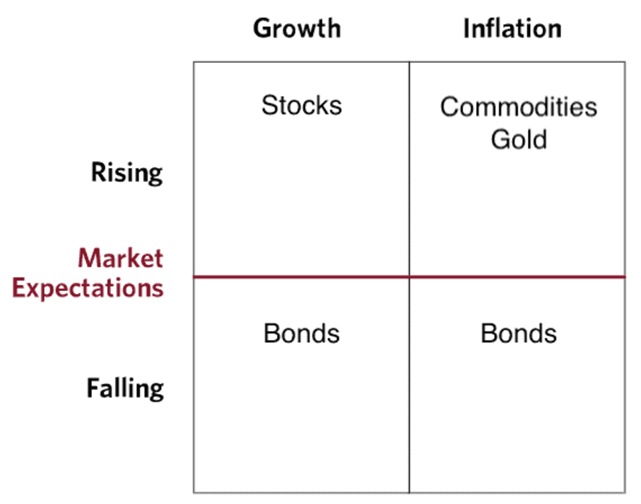

Source: Bridgewater

The key is that these different economic environments don’t all occur with the same frequency. For instance, periods of high economic growth happen more often those of high inflation. In his portfolio, Dalio weighted the different assets accordingly.

Dalio’s All Weather Portfolio

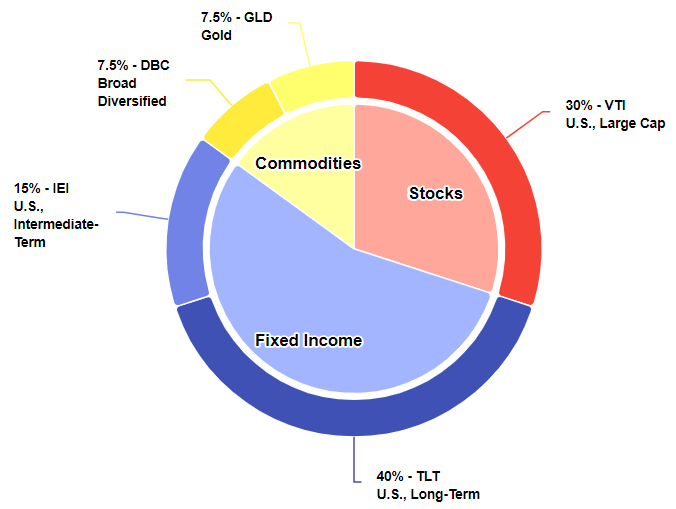
Dalio has been circumspect about his portfolio’s exact contents for much of its history (even to his own clients). However, he later revealed how an individual investor could set up an All Weather Portfolio via ETFs:

Source: www.lazyportfolioetf.com

The portfolio has a heavy weighting to bonds, with 40% in long-term bonds, and 15% in intermediate bonds. Stocks are 30% of the portfolio, while commodities including gold make up the remaining 15%.

For Australian investors, you could switch the US stock and bond holdings to international ones, or a mix of Australian and international, depending on your needs.

How has the All-Weather Portfolio performed?

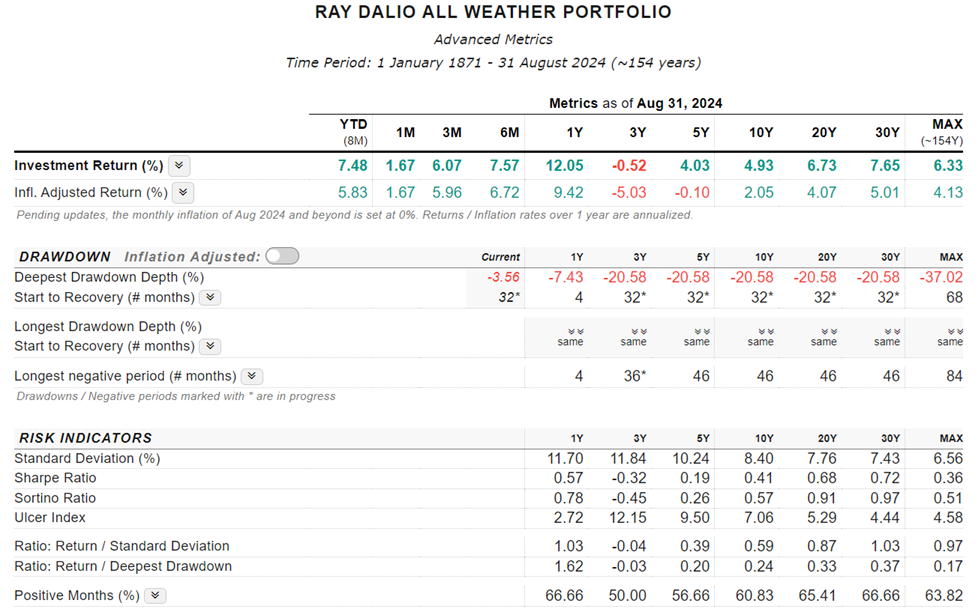
Dalio’s portfolio has performed reasonably well over time. It’s returned 6.7%, 7.7%, and 6.3% per annum (p.a.) over periods of 20, 30, and 154 years respectively.

It’s done that taking much less risk than most other portfolios. For example, $US1 has turned into US$10 over the past 50 years, and during that time, the maximum decline for the portfolio has been 21% (in 2022). And during the GFC, the portfolio only went down 12% from peak to trough.

Since 1871, positive returns have happened 96.1% of the time over three-year periods, and 98.6% of the time over five-year periods.

Source: www.lazyportfolioetf.com

All up, the portfolio has achieved its objective of providing steady returns through economic cycles.

Harry’s Browne’s Permanent Portfolio

The less well-known Harry Browne can also be considered a pioneer of the All Weather portfolio. Browne was a financial adviser and writer who wrote a book in 1970 predicting that high inflation was on the way and that investors should load up on commodities, especially silver and gold. As you can imagine, he made a personal fortune from getting this right.

However by the early 1980s, he knew the tide had turned and he became a passive investing advocate in the mold of John Bogle. That got him thinking about an investment portfolio that could perform under all circumstances.

He wrote a series of articles which culminated in the 1999 book called Fail-Safe Investing. He set out to build a bulletproof portfolio that would meet three requirements:

  • Safety
  • Stability
  • Simplicity

Browne wanted to make sure that his portfolio could cover itself against all possible futures. He put those possible futures into four categories:

1. Prosperity. A period during which living standards are rising, the economy is growing, business is thriving, interest rates usually are falling, and unemployment is declining.

2. Inflation. A period when consumer prices generally are rising. They might be rising moderately, rapidly, or at a runaway rate.

3. Tight money or recession. A period during which the growth of the supply of money in circulation slows down. This leaves people with less cash than they expected to have, and usually leads to a recession – a period of poor economic conditions.

4. Deflation. The opposite of inflation. Consumer prices decline and the purchasing power value of money grows.

Browne theorised that if you were protected in these four situations, you’d be protected in all situations.

Note that if you’re thinking that Browne’s economic scenarios are similar to Dalio’s, you’re right.

Browne thought four investments could cover the different economic environments:

  • Stocks to take advantage of prosperity. They tend to do poorly during periods of inflation, deflation, and tight money, but over time those periods don’t undo the gains that stocks achieve during periods of prosperity.
  • Bonds also take advantage of prosperity. Also, they profit when interest rates collapse during deflation. Bonds poor less well during times of inflation and tight money.
  • Gold is a great asset during inflation. Though it generally does poorly during times of prosperity, tight money, and deflation.
  • Cash is most profitable during a period of tight money. Cash is essentially neutral during a time of prosperity, and it’s a big loser during times of inflation.

This formed the basis of Browne’s Permanent Portfolio:
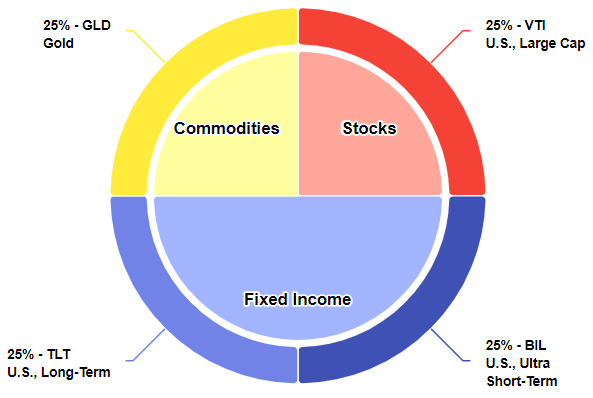

Source: www.lazyportfolioetf.com

The performance of Browne’s Permanent Portfolio

The portfolio has provided the steady, low risk returns that Browne set out to achieve. It’s returned 6.9%, 6.8%, and 5.8% p.a. over periods of 20, 30, and 154 years respectively. It’s done that with remarkably low volatility. The largest peak to trough drawdown over the past 50 years has been 16% (in 2022). In 2008, the portfolio declined only 12% from the peak. And over every five year period since 1871, the portfolio has made money.
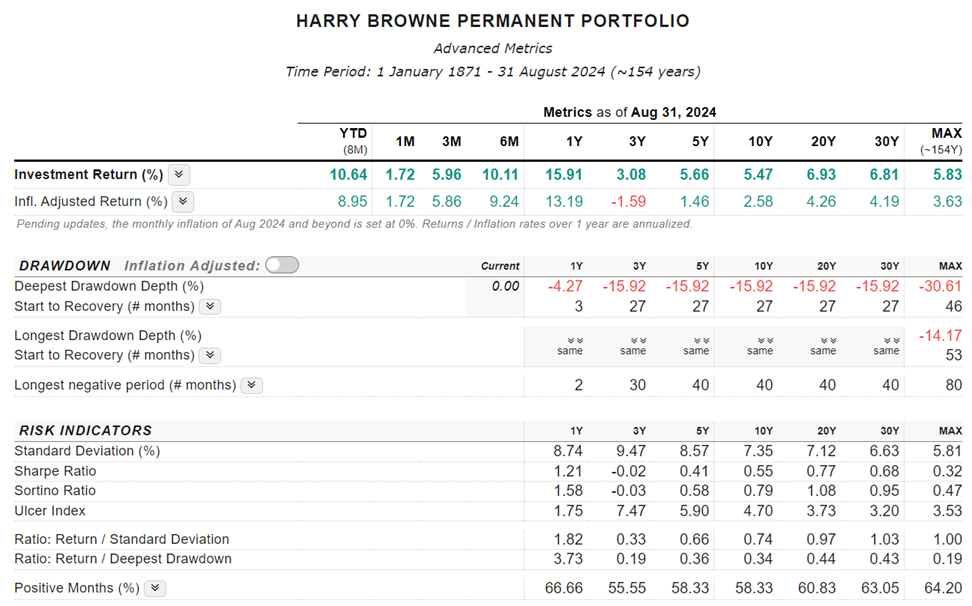

Source: www.lazyportfolioetf.com

The pushback to Browne’s portfolio is from the large holdings in both gold and bonds. Many wouldn’t be comfortable with this. However, Browne’s theory of how these assets could help a portfolio withstand certain economic conditions has proven relatively sound over time.

Note also the similarities between Browne and Dalio's portfolios.

The Talmud Portfolio

Dalio and Browne’s strategies may be considered modern-day upgrades on a more ancient tradition of All Weather portfolios. The Talmud, a collection of Jewish texts from around 2,000 years ago, said:

“Let every man divide his money into three parts, and invest a third in land, a third in business, and a third let him keep in reserve.”

US-based investment commentators suggest a Talmud strategy today might look something like this:
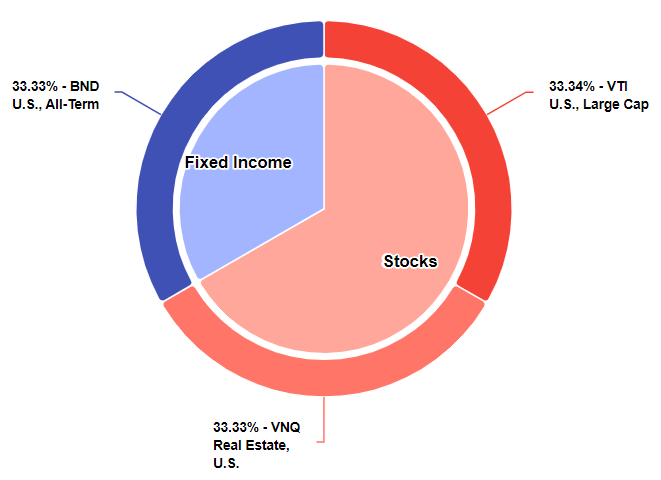

Source: www.lazyportfolioetf.com

The Talmud portfolio has generally performed better than Dalio or Browne’s versions. It’s returned 7.7%, 8.6%, and 7.8% p.a. over periods of 20, 30, and 154 years respectively.

However, it’s achieved those returns by taking more risk. Drawdowns for the portfolio have been sharper. From peak to trough in 2022, it lost 23%. In 2009, it declined 40%.
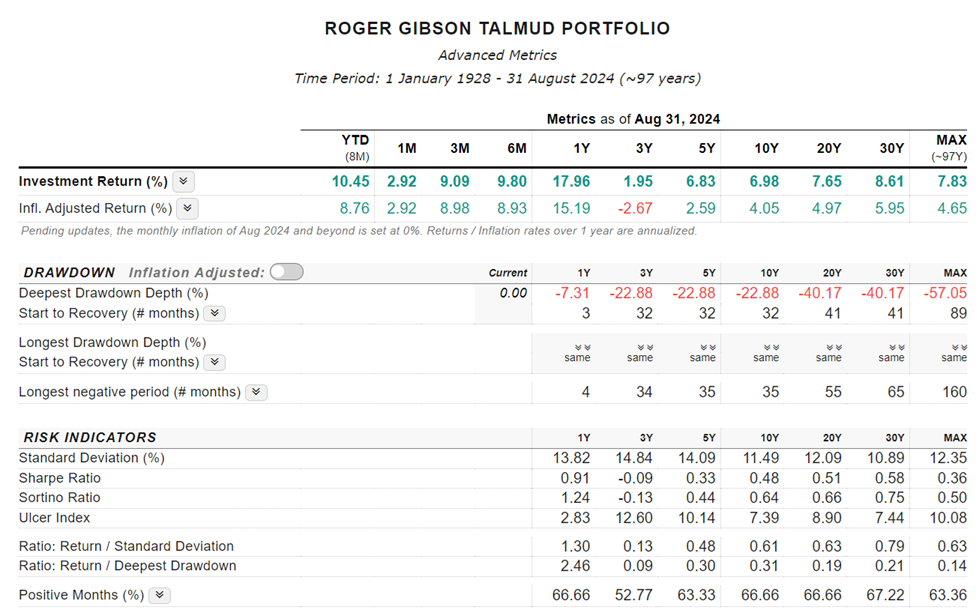

Source: www.lazyportfolioetf.com

If having a portfolio that can prove resilient under all economic conditions is the goal, then this version of the Talmud doesn’t pass the test.

Like much of finance, things can evolve and get better with time – from the Talmud, to Browne, to Dalio, you can see the progression towards more modern, sophisticated All Weather portfolios.

The pros and cons of All Weather portfolios

All Weather portfolios such as those mentioned are simple and easy to operate. They won’t make you rich, but you won’t lose your shirt either. Therefore, it suits the risk averse. It’s also for the wealthy, who may want to focus more on wealth preservation.

The downside of the strategy is that the lower risk comes at the expense of returns. Those after high growth aren’t going to find that with these portfolios.

It may also be difficult to hold portions of the portfolios over long periods. For instance, holding a lot of bonds over the past four years would have tested even seasoned investors.

How the All Weather Portfolios compare to 60/40

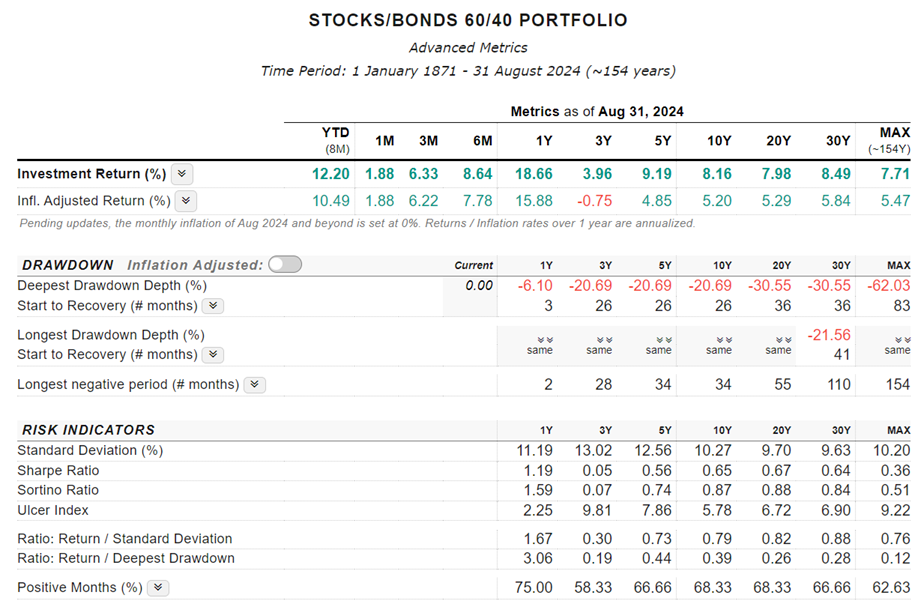
An obvious question is how the All Weather portfolios of Dalio and Browne compare to the more standard stock/bond allocations such as the 60/40. Generally, the 60/40 has delivered better returns, though with more risk attached.

Over the past 30 years, a 60/40 portfolio has returned 8.5% p.a. in US dollar terms, compared to Dalio’s All Weather strategy of 7.7% p.a, and Browne’s Permanent Portfolio of 6.8% p.a.

However, the 60/40 has had much larger drawdowns during that period. In 2022, Browne’s portfolio did best, losing only 16% from peak to trough compared to the 60/40 and Dalio both declining 21%.

In 2009, the story was different. Dalio lost 12%, Browne 13% and the 60/40 went down 31%.

Drawdowns from other periods such as 2000-2002 and the 1970s were also much larger for 60/40 compared to the other portfolios.

That’s reflected in risk measurements for 60/40 such as standard deviation in the table below.

Source: lazyportfolioetf.com

Risk and return are interrelated

Last week, I went through how to build an investment portfolio from scratch. I’ll repeat what I said in that article: there’s no thing as a perfect portfolio. Each portfolio has trade-offs. All you can do is to allocate assets in a way that gives you a decent chance to achieve your goals.

And there’s really one golden rule in asset allocation: risk and return are interrelated. If you want higher returns, you’re generally going to have to take more risk. And vice versa.


James Gruber is the Editor of Firstlinks.


  •   11 September 2024
  • 23
  •      
  •   
23 Comments
CC
September 12, 2024

Such a huge amount in bonds is crazy. Everyone knows that in the long term stocks way outperform bonds.
No thanks.

Don Ezra
September 12, 2024

Superb piece, excellent analysis, thank you!

Simon Taylor
September 12, 2024

Who invests for 154 years, or even 30 years? Appalling performance really. Forget the idea of 'set and forget' Be a little more active. And forget the BS of Bonds.

CC
September 13, 2024

most people when they enter the workforce and have employer funded Super account are invested for at least 30 or 40 years. When I retire at about 70 my investment and Super accounts will have been running for 50 years

Kevin
September 13, 2024

Well Simon there is a bank called CBA..After the coming dividend then after 33 years of appalling performance and set and forget you'll have ~ $1,000,000.This is from a start of $5400, This appalling performance is achieved by reinvesting dividends.

Reputedly Einstein said it is the 8th wonder of the world.

Buffett is supposed to have said if you don't see it in the first two seconds,you'll never see it in your entire life..

The number you need is 17%..The next number you need is 1.After that you need the number 154.


The acronym is CAGR .Put them in the right order and the result is astonishing.

Not a lot of people can solve that,it takes 2 seconds to see it.Then it takes 154 years to say "you can't do that". I wonder how many 2 second periods there are in 154 years.Perhaps it would be easier for the old put 1 grain of rice on the first square of a chess board,then double it for the rest of the squares.There's some serious exponential growth there.

Dudley
September 13, 2024

"you need the number 154":

To explain clearly and simply using your example, you need the number 33:
= (1000000 / 5400) ^ (1 / 33) - 1
= 17.1%

Kevin
September 14, 2024

I'll have a laugh at you Dudley. The pantomime mathematician determined to get everything precisely wrong to 3 decimal places

Now,do you want to be right,or do you want to make money. What could that possibly mean

Tell me Dudley,could you find the number 33 in my post?. Could you have enough common sense to deduce anything from those numbers 33 and 17..

To really amuse me Dudley when are you going share your amazing failures with us.I never made any money,and I never got any of the maths right .I got everything precisely wrong to 3 decimal places

It's a very old and wise saying,do you want to be right,or do you want to make money.We can depend on you to not make money,and not get anything right

Keep the faith Dudley

Dudley
September 15, 2024

The absence of mathematics leaves narrative for communication.
More often long-winded, ill-defined and inaccurate.

The formula for calculating Compound Annual Growth Rate is short, well defined and precise, but requires numbers:
= (FinalValue / InitialValue) ^ ( 1 / TimeYears) - 1
or
= RATE(TimeYears, -InitialValue, FinalValue)

The resultant number can be rounded to reduce precision in excess of accuracy.

Errol
September 12, 2024

The inverse relationship between stocks and bonds is not as black and white as it used to be. Holding a large allocation to bonds over the last 4 years has been a huge detractor to returns - see QSuper’s Balanced Risk Adjusted fund for a good example of this. Low volatility sure, but at a huge cost to performance

I’m retired and while my portfolio is mildly aggressive I wouldn’t contemplate a 50% allocation to bonds.

Dudley
September 13, 2024

Minimum real return rate required by an older retiree:

To 95, from 75, equivalent of Age Pension 26 f * $1,682.8 / f = $43,752.8 / y:

Capital $10,000,000:
= RATE((95 - 75), 43752.8, -10000000, 0, 0)
= -16.77% / y [ Have to be trying hard to lose ]

Capital $3,000,000:
= RATE((95 - 75), 43752.8, -3000000, 0, 0)
= -9.66% / y [ Don't need to try ]

Capital $1,000,000:
= RATE((95 - 75), 43752.8, -1000000, 0, 0)
= -1.24% / y [ Need to be trying to win ]

Capital $300,000:
= RATE((95 - 75), 43752.8, -1000000, 0, 0)
= +13.41% / y [ Age Pension to the rescue ]

rk
September 13, 2024

beautiful. this is the hub of a great article. [nb: its much tougher to outpeform the pension if used nominal returns!]. and if you want to retire at 55, you need (more than) $3M in the bank to be outperforming the pension. this calculation also ignores risk and volatility of investing vs the pension. bit depressing really if you are an investor.
Capital $3,000,000:
= RATE((95 - 55), 43752.8, -3000000, 0, 0)
=-2%/y [ Need to be trying to win ]

Dudley
September 14, 2024

"tougher to outpeform the pension if used nominal returns":

Real to nominal rate = (1 + RealRate) * (1 + InflationRate) - 1

Rod
September 13, 2024

What about the idea of a monthly (or quarterly) rotation? Where out of a pre-chosen universe of ETFs the top 3 (or 4 or 5), judging by rate-of-return over a decided period (3 or 6 months?) replace the present top 3 (or 4 or 5) ?
Perhaps something to be considered. One reads about these sort of ETF rotation portfolios in the US.

James Gruber
September 13, 2024

Hi Rod,

I am not sure more frequent rotation as you suggest would add much to returns. And it might add fees, given increased trading etc.

James

Trevor
September 13, 2024

“It’s also for the wealthy, who may want to focus more on wealth preservation.”

Exactly. If you have enough, look after it, don’t be greedy and hope the government doesn’t take it away from you.

Dudley
September 13, 2024

"All Weather portfolios such as those mentioned are simple and easy to operate. They won’t make you rich, but you won’t lose your shirt either. Therefore, it suits the risk averse. It’s also for the wealthy, who may want to focus more on wealth preservation."

"The downside of the strategy is that the lower risk comes at the expense of returns. Those after high growth aren’t going to find that with these portfolios."

'If you have enough, look after it, don’t be greedy and hope the government doesn’t take it away from you.'

A 'Life Support Portfolio' suitable for those with more than enough capital relative to 'Cost of Living Expenditure Rate' please?

Some might say: 'Annuity!'
but providers can fail.

Some might say: 'Treasury Indexed Bonds!'
https://www.aofm.gov.au/securities/treasury-indexed-bonds
but they are not making many, it is not possible to construct a useful bond ladder from the meagre offerings and the market value fluctuates with market interest rates.

What does the author and reader say?

Mark Hayden
September 14, 2024

Time-frames are vital. Your use of "risk" is "volatility over short- medium time-frames". Every investor has part of their bucket (part of their investments) to be invested for the long-term, thence they want the best long-term returns. Over rolling 10-15 year returns, stocks thrash commodities, gold and bonds. Asset allocation models should be simpler and more effective than those three portfolios....I would change your summary section - "If you want higher returns, you’re generally going to have to take more risk" to - If you want higher returns, you’re going to have to accept volatility over short time-periods (and this is not a problem if you are not a forced seller).

John De Ravin
September 16, 2024

I completely agree, Mark. There is a focus in many places on “volatility” defined as the standard deviation of annual returns but short-term fluctuations are only an issue if either:
(a) the investor is psychologically affected by adverse movements in market values, or
(b) the investor makes flawed decisions as a result of market fluctuations or
(c) the investor forced to sell a significant proportion of their assets at reduced prices to maintain lifestyle.

By way of illustration, in the Australian superannuation environment in pension phase, where typical grossed up yields on stocks may be 5-6%pa, so unless a retiree’s drawdown rate is quite high, they just aren’t going to need to sell much of their asset base to maintain lifestyle when the market suffers one of its periodic panic attacks. A very modest allocation to cash should resolve this issue almost entirely (and I’m NOT talking about 5 years’ expenditure!!).

So I really think we need to question the “60/40” type asset allocations or the “100 minus your age” allocations to equities. People are foregoing longer term returns without actually incurring longer term “risk” to their living standards.

I do think that “riskier” asset allocations need to be combined with appropriate spending rules but developing sensible spending rules should not be beyond the skill of financial planners or financial planning software.

michael
September 15, 2024

Surely with buy & hold portfolios, the dividend/distribution stability or growth is paramount?
This is where USA is different to Australia. US tax system seems to prefer capital gains, whereas Aussies like dividends.

In investments that are expected to fluctuate by price, price fluctuations are not the risk. Permanent loss of capital, or decreased dividends, would be the risk.

Steve
September 15, 2024

No mention of rebalancing? Does this occur annually? Also I wonder with all the indexes available these days is an old fashioned market cap index the best choice? Many layers to this onion.

James Gruber
September 16, 2024

Hi Steve,

Annual rebalancing.

Best,
James

Steve
September 15, 2024

Why First Mortgage investments continue to grow in popularity.

William Clarke
September 17, 2024

So stocks are bulletproof then. No worries I'll sell my bonds. I don't think so.


Leave a Comment:

RELATED ARTICLES

The challenges of building a portfolio from scratch

The biggest risk that buy-and-hold investors ignore

The most important investment decision you’ll ever make

banner

Most viewed in recent weeks

Are you making these SMSF mistakes?

After four decades advising investors, there are a few common mistakes I've seen SMSF investors make. From holding too much cash and chasing yield to overtrading and trusting tips. Are these errors costing you?

Why have Australian living standards 'fallen' and how do we fix it?

For the last few years there has been much talk of a 'cost-of-living' crisis in Australia and of 'falling living standards'. Lately this has flared up again with the pickup in inflation resulting in a renewed fall in real wages.

Will you run out of money in retirement?

Fear of running out has become a defining retirement anxiety. Why do some retirees die with substantial wealth while others deplete their nest egg? Evidence suggests the answer is more complicated than we think. 

Retirement spending is not one-size-fits-all

New data challenges the idea that Australians are underspending their super. The bigger issue may be helping retirees navigate complexity, make confident decisions and use their savings to support security, wellbeing and choice.

Four options for an income investor’s next dollar

What if Australia’s golden age of dividends is ending? Rather than overhaul your portfolio, it may be worth considering where new capital can work harder. I discuss four income strategies and the trade-offs behind each.

The missing link in the CGT debate

A little-noticed consequence of Labor’s tax changes could have implications well beyond investors’ tax bills. The issue raises bigger questions about incentives, capital allocation and the drivers of long-term economic growth.

Latest Updates

SMSF strategies

Meg on SMSFs: What do we think about reversionary pensions these days?

Reversionary pensions have long been a staple of SMSF estate planning, but are they still the best option? Meg Heffron revisits a once-clear favourite and asks whether changing super rules have shifted the balance.

The ageing ‘crisis’ has not and will not happen

Rising age dependency is frequently treated as a warning sign for economies. But when actual workforce participation is examined, a strikingly different picture emerges about ageing, productivity and economic sustainability.

Retirement

How does the 4% rule stack up?

The 4% rule has long been retirement's gold standard. But after a difficult period for investors, fresh analysis suggests a more conservative approach may significantly improve the chances of making savings last.

Shares

Four charts that expose market concentration risk

Investors have recently been rewarded for backing market leaders, but history suggests this eventually comes at a cost. Now may be the time to review whether your portfolio is carrying unintended risks beneath the surface.

Investment strategies

The case for gearing beyond property

Most Australians gear into property but ignore shares. That may be a mistake. Used carefully, geared equity strategies can enhance long-term returns, reduce cash tied up in growth assets and support retirement income goals.

Economy

Australia's $1 trillion debt pile

The headlines exclaiming that Australian government debt has hit A$1 trillion and US government debt has hit $40 trillion has turned heads, but how serious are they really? Will Australia's mix of debt create challenges?

Economy

Has 100 years of growth made us any happier?

For decades, GDP has been the benchmark for economic success, but has it made us materially happier? If happiness does not rise in lockstep with prosperity, are we overlooking what constitutes a successful society?

Sponsors

Alliances

  • ASA-Logo-RGB-ActiveGreen-web.png

© 2026 Morningstar, Inc. All rights reserved.

Disclaimer
The data, research and opinions provided here are for information purposes; are not an offer to buy or sell a security; and are not warranted to be correct, complete or accurate. Morningstar, its affiliates, and third-party content providers are not responsible for any investment decisions, damages or losses resulting from, or related to, the data and analyses or their use. To the extent any content is general advice, it has been prepared for clients of Morningstar Australasia Pty Ltd (ABN: 95 090 665 544, AFSL: 240892), without reference to your financial objectives, situation or needs. For more information refer to our Financial Services Guide. You should consider the advice in light of these matters and if applicable, the relevant Product Disclosure Statement before making any decision to invest. Past performance does not necessarily indicate a financial product’s future performance. To obtain advice tailored to your situation, contact a professional financial adviser. Articles are current as at date of publication.
This website contains information and opinions provided by third parties. Inclusion of this information does not necessarily represent Morningstar’s positions, strategies or opinions and should not be considered an endorsement by Morningstar.