Register For Our Mailing List

Register to receive our free weekly newsletter including editorials.

Home / 90

Currency hedging for international equity portfolios

With recent volatility in the value of the Australian dollar (AUD), investor attention is again drawn to the topic of currency hedging. This article looks at the impact of currency on international equity investments for an Australian investor and explores some of the factors that influence the decision to hedge currency exposure.

The impact of currency risk

Currency risk is typically a significant proportion of the total risk of an unhedged international equity portfolio which can have a large impact on returns. For example, over the 12 months to February 2009, unhedged investors were about 20% better off than their hedged counterparts, while over the 12 months to March 2010 they were about 40% worse off (Chart 1).

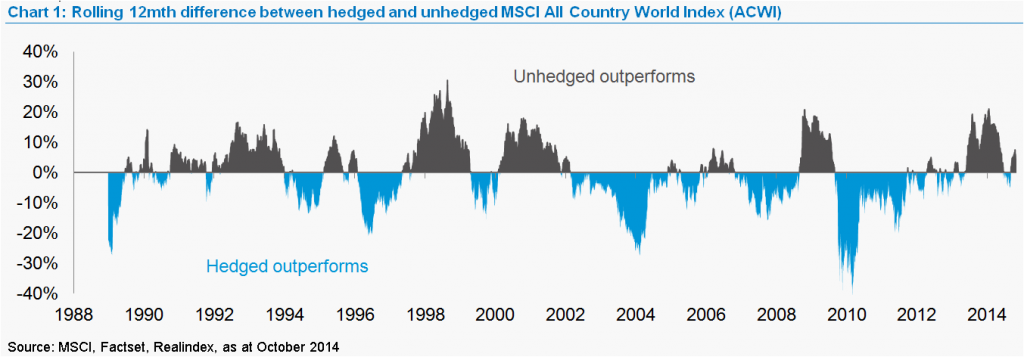
Over the long term, the difference between hedged and unhedged returns is less dramatic because currencies have a tendency to fluctuate around a long-term average. However, hedged investors have been better off by an average of 1.2% per annum (ignoring hedging and carry costs) over the 26 years since 1988. The hedged portfolio has had the added benefit of lower volatility (on average) than the unhedged (14.0% vs 14.8%).

The relationship between currency and equity returns

In the aftermath of the GFC, the volatility of a currency-hedged All Country World Index (ACWI) portfolio rose above that of an AUD unhedged ACWI portfolio; an unusual situation that persisted until mid-2013 (Chart 2).

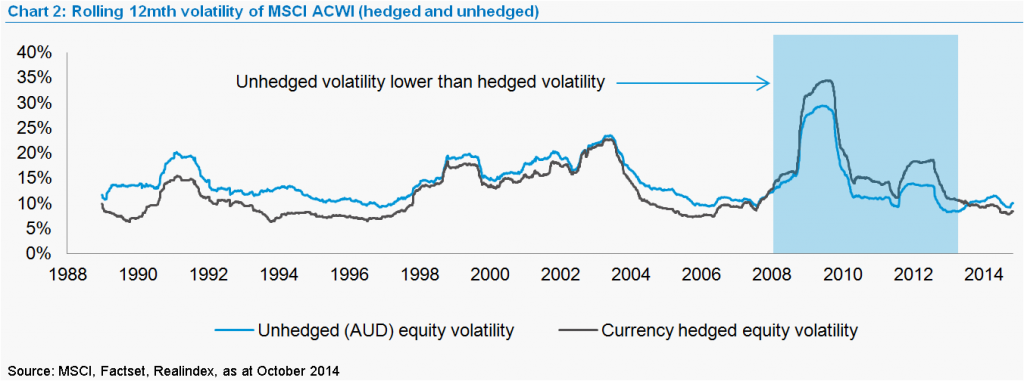
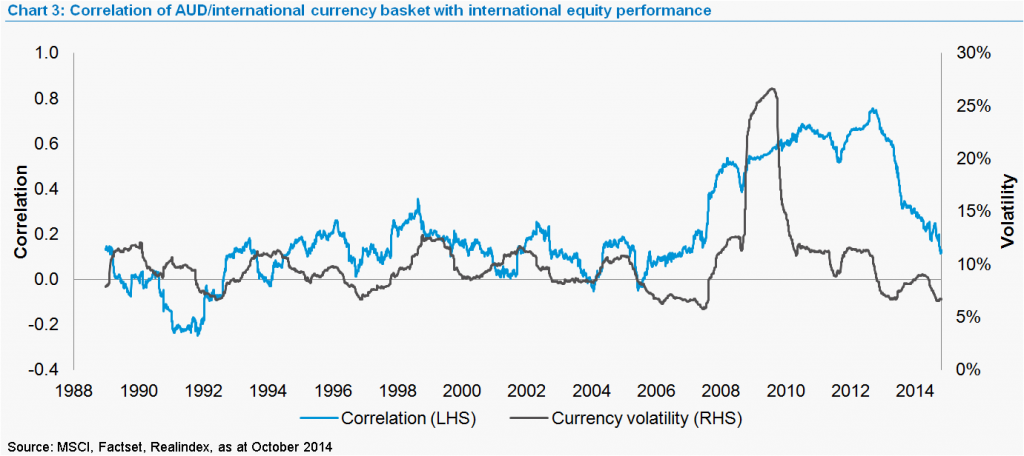
In other words, it became more ‘risky’ for an investor to hedge their AUD currency exposure than to not hedge during this period. This somewhat counter-intuitive phenomenon was the result of a significant increase in correlation between the AUD currency basket and international equity returns (as shown in Chart 3). During this period the currency exposure of an AUD ACWI equity portfolio became a diversifying position. From a ‘total risk’ perspective it was hard to justify hedging currency risk during this period because it increased overall risk. However correlations have now returned to more normal levels and hedged volatility has again dropped below unhedged on a trailing 12 month measure.

This event clearly illustrates that relationships between financial assets are not guaranteed to remain stable and any assumptions that are made as part of the investment process need to be monitored.

Optimal currency hedge ratios

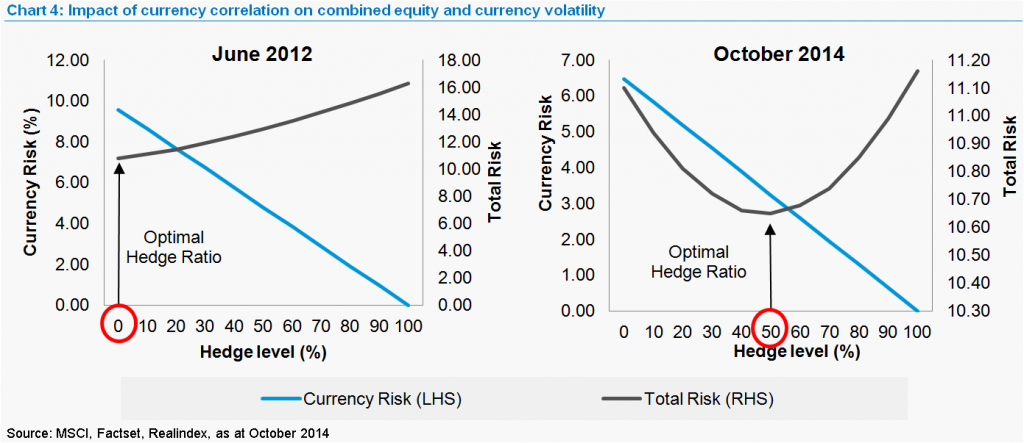
To illustrate the impact of this correlation change we calculate the optimal currency hedge ratio for an investor trying to minimise the total volatility of their global equity portfolio by adjusting the currency hedge (Chart 4). The grey lines show the total risk of equity and currency combined, while the light blue line shows the currency risk in isolation. The optimal total-risk hedge level will be the lowest point on the grey line. We see that in June 2012 the optimal total-risk position was to leave AUD exposure completely unhedged, while the current optimal position is to be roughly 50% hedged. A hedge level of 50% implies that half of the total currency exposure is hedged. Of course if your objective is to eliminate as much currency risk as possible then the optimal choice is always to be fully hedged, regardless of total portfolio volatility.

Hedging returns

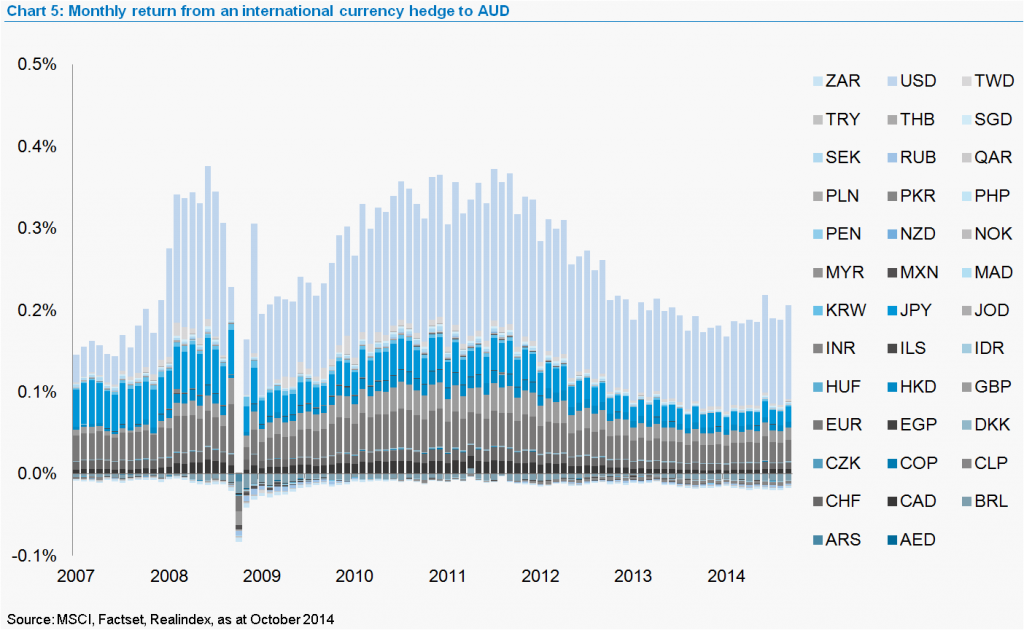
Some investors may not be aware that there is a return associated with a currency hedge that is independent of currency and market movements. This return is the ‘cost of carry’ (or a ‘return of carry’) which reflects interest rate differential between the base currency and foreign currency exposures which are being hedged; it is priced into the currency ‘forward points’. A currency hedge effectively earns the domestic interest rate and pays the foreign rate; for AUD investors this has historically provided a benefit, as illustrated in Chart 5. This benefit would reduce if, for example, US interest rates were to rise while AUD rates remain on hold. You will notice there is variability in the hedging return, which means that it is not ‘risk free’, however the variation in forward returns is typically much lower than the variation in the currency returns which are being hedged.

Why hedge currency exposure

So does it make sense to hedge currency exposure? There are several reasons investors might want to consider currency hedging, including:

  • Prior to 2008, hedging currency exposure reduced the total volatility of an AUD based international equity portfolio. Now that correlations have returned to more historically normal levels this may be the case again going forward (though of course this is not guaranteed).
  • If a view is held on the AUD, this can be reflected in the level of currency hedge. If there is no view on the currency then arguably it is unwise to take exposure to a source of risk from which you have no expectation of return and therefore we would argue that currency hedging should be considered in this scenario too.
  • Historically there has been a carry benefit to hedging the AUD due to the prevailing interest rates. As long as interest rates in Australia are higher than the weighted average rates of international markets, then this may remain the case.

Summary

At Realindex we always encourage investors to take a long-term view on their investment. If an investor holds a long term view on the AUD then it is sensible to implement a hedging strategy that reflects that view (be it hedged or unhedged), and stick to it. If no view is held on the currency, then there are still very valid reasons to consider hedging currency exposure. In either case, it is important to ensure that any performance benchmark is aligned with the strategic hedging decision, and that the risk and cost implications of this decision are fully considered.


Scott Hamilton is a Senior Quantitative Analyst with Realindex Investments. This article is for general educational purposes and readers should seek their own professional advice.


2 Comments
Capital Markets Guy
December 01, 2014

Hi Scott,

Thanks for this work. Could you help me to understand were you got your hedged ACWI return series from (I can't see one published on Bloomberg by MSCI) as I am trying to replicate these charts and are unable to.

When I look at similar charts for the MSCI Developed Markets index, for example, it looks like unhedged returns are generally less volatile than hedged returns (the opposite of what you find here).

Also, I found it interesting that you say that hedged investors receive the interest rate differential between the two countries involved - my understanding was that both hedged and unhedged returns receive the interest rate differential, but only the unhedged returns receive the effect of changes in exchange rates (with the difference between the two return series being equal to the so-called "currency surprise" effect).

Thanks again for sharing.

Scott Hamilton
December 01, 2014

Hi Capital Markets Guy.

When hedging with forwards you effectively lock in the interest rate differential every time you set the hedge because this is built into the forward rate. You would probably want to hedge at the prevailing spot rate but you can't, the best you can do is the forward rate which has the interest rate differential baked into it.

As for the ACWI data... I cheated and used "local currency" index returns as a "perfectly hedged" proxy (because I wanted to go back as far as possible with daily data). I haven't looked at the Developed World data but I would have expected it to display similar pattern. Unhedged volatility has definitely been lower than "currency neutral" volatility since 2008, however before that it seems to be predominantly the other way round.

Hope this makes sense.

Regards

Scott


Leave a Comment:

RELATED ARTICLES

Does currency hedging provide an edge?

To hedge or not to hedge?

Currency risk deserves more than a coin toss

banner

Most viewed in recent weeks

Raising the GST to 15%

Treasurer Jim Chalmers aims to tackle tax reform but faces challenges. Previous reviews struggled due to political sensitivities, highlighting the need for comprehensive and politically feasible change.

7 examples of how the new super tax will be calculated

You've no doubt heard about Division 296. These case studies show what people at various levels above the $3 million threshold might need to pay the ATO, with examples ranging from under $500 to more than $35,000.

Are franking credits hurting Australia’s economy?

Business investment and per capita GDP have languished over the past decade and the Labor Government is conducting inquiries to find out why. Franking credits should be part of the debate about our stalling economy.

Here's what should replace the $3 million super tax

With Div. 296 looming, is there a smarter way to tax superannuation? This proposes a fairer, income-linked alternative that respects compounding, ensures predictability, and avoids taxing unrealised capital gains. 

The rubbery numbers behind super tax concessions

In selling the super tax, Labor has repeated Treasury claims of there being $50 billion in super tax concessions annually, mostly flowing to high-income earners. This figure is vastly overstated.

9 winning investment strategies

There are many ways to invest in stocks, but some strategies are more effective than others. Here are nine tried and tested investment approaches - choosing one of these can improve your chances of reaching your financial goals.

Latest Updates

Taxation

100 Aussies: seven charts on who earns, pays, and owns

The Labor government is talking up tax reform to lift Australia’s ailing economic growth. Before any changes are made, it’s important to know who pays tax, who owns assets, and how much people have in their super for retirement.

7 key charts on the state of the Australian property market

The Australian property market stirs fierce debate - often bullish optimism versus crash predictions. But beyond the noise, seven charts reveal what's really driving prices and the outlook for residential real estate.

A simple alternative to the $3 million super tax

Division 296 aims to introduce improved fairness into the superannuation system, yet is overly complex. This scours the world for better ideas and suggests a simpler alternative which can achieve the same goals.

CBA and the index conundrum for super funds

After the hyperbolic rise in CBA shares, super funds are floating the idea of carving out the weightings of ASX bank securities and indexing them within their portfolios. This looks at why that might be a big error.

Strategy

10 policies to drive Australian productivity higher

Here's a comprehensive list of proposed reforms to fix Australia's stagnating economy, including introducing a flat income tax rate, reducing migration, and making childcare tax-deductible.

Interviews

Where to find big winners in Asia

As more money looks for a home outside the US, Asia may soon get some love. Fidelity's Anthony Srom outlines the best places in Asia to invest, including in Chinese consumer names, Indian financials, and Thailand.

Investment strategies

We have trouble understanding the time value of money

We overvalue the present and underestimate the future - it’s a cognitive glitch called hyperbolic discounting. It affects savings, spending, and loans, and it's more common - and costly - than we think. 

Sponsors

Alliances

© 2025 Morningstar, Inc. All rights reserved.

Disclaimer
The data, research and opinions provided here are for information purposes; are not an offer to buy or sell a security; and are not warranted to be correct, complete or accurate. Morningstar, its affiliates, and third-party content providers are not responsible for any investment decisions, damages or losses resulting from, or related to, the data and analyses or their use. To the extent any content is general advice, it has been prepared for clients of Morningstar Australasia Pty Ltd (ABN: 95 090 665 544, AFSL: 240892), without reference to your financial objectives, situation or needs. For more information refer to our Financial Services Guide. You should consider the advice in light of these matters and if applicable, the relevant Product Disclosure Statement before making any decision to invest. Past performance does not necessarily indicate a financial product’s future performance. To obtain advice tailored to your situation, contact a professional financial adviser. Articles are current as at date of publication.
This website contains information and opinions provided by third parties. Inclusion of this information does not necessarily represent Morningstar’s positions, strategies or opinions and should not be considered an endorsement by Morningstar.