Two recent papers looked at the historically strong performance (and recent weak performance) of what are known as ‘sin’ stocks. The analysis found that the stocks’ past outperformance (or alpha) was not as simple as reaping the rewards of a ‘deal with the devil’.
What are sin stocks?
‘Sin’ stocks are usually considered to be those whose activities are dominated by what would be considered unethical or immoral activity, usually alcohol, tobacco, gambling, adult entertainment and weapons.
We looked at two relevant papers covering the returns of such stocks:
- Blitz, D. and F.J. Fabozzi. Sin Stocks Revisited: Resolving the Sin Stock Anomaly, 2017
- Jorgensen, A. 'Sin' Stock Exclusions: What is the Impact?, UBS Global Research, October 2019
The data in both papers is drawn from Kenneth French’s data library and covers tobacco, alcohol and weapons.
Note that this approach identifies only the manufacturers of these goods, and indeed only firms for which manufacturing the product is their primary business.
Performance of sin stocks in history
Chart 1 below (from the UBS paper) shows that these stocks had very strong performance from the early 2000s to about 2016 or 2017. In fact, the data show that over the past 43 years, a cap-weighted benchmark of the largest 50 ‘sin’ stocks has outperformed the MSCI World by nearly 5% per year.
Chart 1: Sin stocks performance v benchmark: outperform the benchmark significantly and then sell-off over the last three years
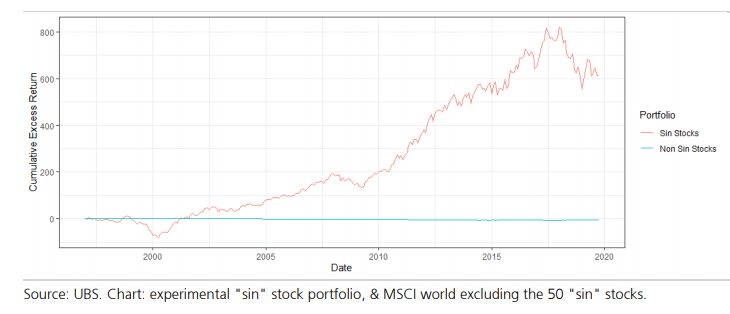
The chart also plots the excess return of a portfolio of the MSCI World without these 50 names, to see what performance drag the portfolio would have had from excluding them. The answer is – very little. In fact, the portfolio of MSCI World, excluding the 50 sin stocks, only underperforms the MSCI World itself by about 6bps (0.06%) per year, as per Table 1.
Table 1: Summary statistics of portfolios of sin stocks, MSCI World (ex-sin stocks) and the MSCI World itself
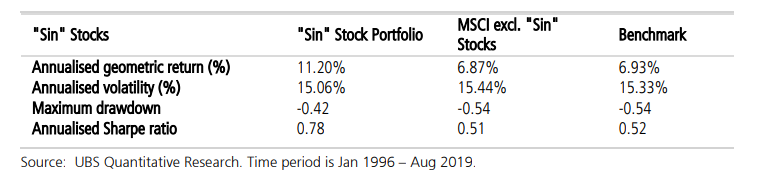
The reason for this is clear – these stocks only actually represent a small component of the investible universe (a global average of 2.2%). Blitz and Fabozzi (2017) state that the size of these stocks in Developed Markets portfolios is not large: “… the combined weight of the sin sectors averages 2.1% for the United States, 3.5% for Europe, 1.6% for Japan, and 2.2% for global.” The UBS paper also notes that “… the low market capitalisation of these sectors means that, in practical terms, excluding them does not lead to significant change in performance.”
Recently, the outperformance of sin stocks has reversed, with a portfolio of 50 sin stocks down about 6% per year for 2017–2019.
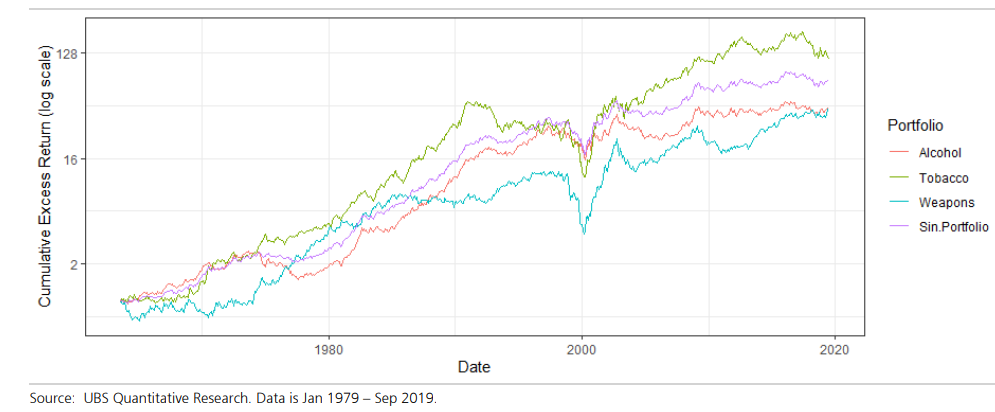
Chart 2 (again from UBS) shows the stocks’ outperformance by broader sector categorisations, over a much longer horizon than Chart 1. The sin stock groupings here are alcohol, tobacco and weapons, which are easier to capture over a long period. All three sectors have participated in this alpha, with tobacco the best. The 1960–1990 period is truly remarkable, with the aggregate sin portfolio creating approximately 16 times the wealth of investing in the broader stock market.
Chart 2: Sin stocks outperformance by sector
Recent performance of sin stocks
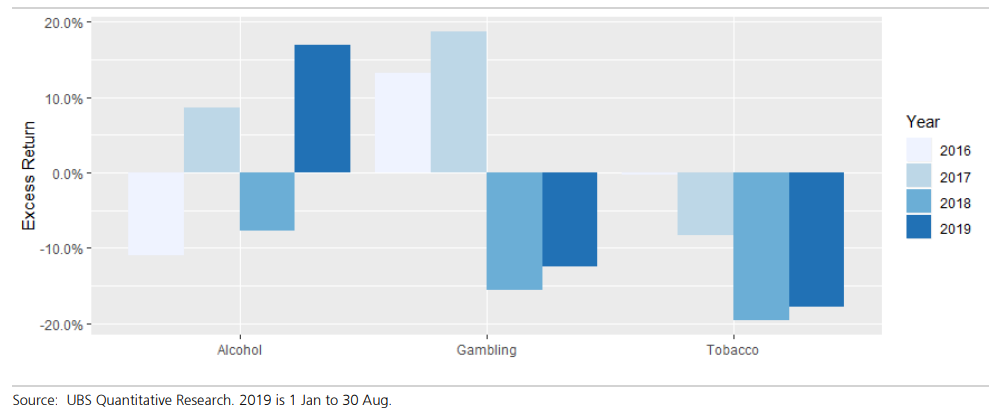
As noted, Chart 3 shows that many sin stocks have sold off very strongly over the past three years. It appears the main drivers have been increased regulations, the rise of ‘vaping’ as a smoking alternative, and investors choosing to divest or exclude the stocks for ethical reasons.
Chart 3: Annual outperformance for each sector 2016-2019
Was there ever any alpha?
At first glance, the above charts would suggest that having an aggressive holding in these sectors would have delivered outperformance (alpha). However, the two papers agree conclusively that while apparent in simple excess return calculations, this alpha does not survive analysis when considering common factors such as size, value or momentum.
That is, there is no specific alpha in these names. The alpha is captured by well-known return factors, and so their factor exposure (and performance) could potentially be replicated by a portfolio of other (‘non-sin’) stocks.
The return factors used to capture any alpha (or detect unique insights) stem from the Fama and French class of models. The Blitz and Fabozzi paper, and the UBS analysis, both use the market return itself plus six other return premium factors:
- Size: smallest stocks over largest stocks, by market cap
- Value: cheapest stocks over most expensive stocks (measured using Book to Price)
- Momentum: highest 12-month momentum stocks over lowest 12-month momentum stocks
- Low beta (or ‘betting against beta’): Low beta stocks over high beta stocks
- Profitability: highest profit margin stocks over lowest profit margin stocks
- Investment (or ‘over investment’): lowest asset growth stocks over highest asset growth stocks
No sin in excluding these stocks
The observed outperformance is subsumed by a set of well-known return factors. Among other things, sin stocks seem to be low beta, are smaller than average and don’t seem to have a systematic value or momentum tilt. Sin stocks can be excluded from a portfolio without compromising potential performance.
David Walsh is Head of Investments at Realindex Investments, a wholly owned investment management subsidiary of First Sentier Investors, a sponsor of Firstlinks. This article is primarily for information. It discusses ideas that are important to the Realindex investment process and clients but may not be implemented in the ways discussed here.
For more articles and papers from First Sentier Investors, please click here.