To state the obvious, ETFs are listed on an exchange in the same way as company shares. However, one key difference is the presence of institutional brokers referred to as either authorised participants (APs) or market makers. Market makers provide price and volume quotes in the ETF and ensure the continuous trading, whereas APs manage the creation and redemption of ETF units in the primary market.
Without wishing to confuse the matter, often APs also act as market makers and hereafter this article refers to both as ‘market makers’. There is an important distinction - only APs engage in the creation and redemption process.
Margins between bid and offer pirces
ETF flows are more specifically the increase or decrease in ETF units on issue as determined by investor supply and demand (a key distinction between ETFs and shares). It is a process that is critical to ETF trading at parity to the Net Asset Value (NAV). There is a limited discount to NAV risk in ETFs bar a marginal risk in bond ETFs in extreme market dislocation events.
For market markers, the main role is to provide liquidity to the ETF based on the ability to continuously create and cancel units in response to supply and demand in the market. But of course, this participation is driven by a profit motive. Market makers seek to generate a profit based on a small arbitrage margin between the price at which the ETF is transacted and the underlying value of the securities that represent the ETF portfolio (the NAV of the ETF).
That margin between the buy price and the sell price is the bid/ask spread. For example, if a market maker is in the market as a buyer, it will bid at a price that is marginally below the NAV of the ETF (the bid spread). Assuming the market maker is ‘hit’ - i.e. there is not a investor offering a slightly higher bid price - the market maker sells the individual shares on market (the redemption process) with the intent of making a marginal arbitrage profit.
To complicate matters further, a market maker may or may not be contracted to maintain a maximum spread, or it may be bound by ASX rules in relation to maximum spreads and minimum bid and ask volume offers. The benefit of a contracted bid/ask spread is it better ensures an ETF remains competitive with other ETFs.
Investors should be aware that it is periods of heightened volatility that spreads are likely to blow out where there is not a contracted bid/ask spread.
ASX-listed bid/ask spreads
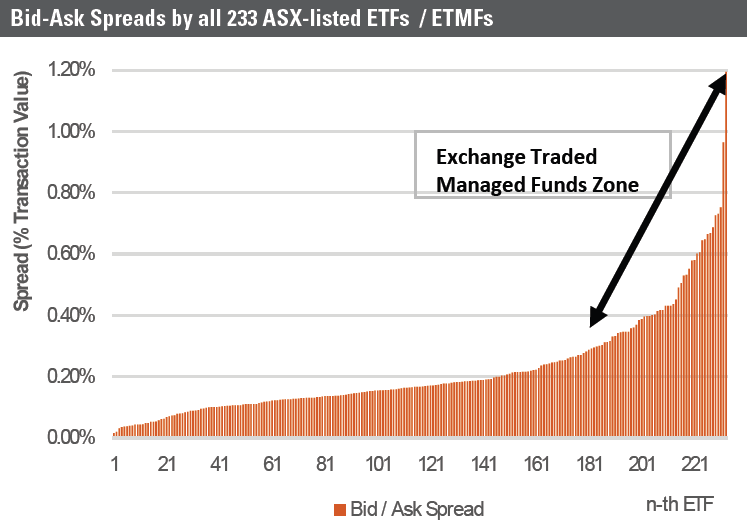
The chart below details the bid/ask spread of all 233 ASX-listed ETFs over the month of January 2022. The amounts are based on the average bid/ask spread over the course of each day of the month divided by two with all daily amounts over the month then averaged to provide the end figure.
The chart presents these levels sorted from lowest to highest. In this month, there was a material variation between ETFs from a low of 0.015%, or 1.5 basis points (bps) to 1.2%, or 120 bps. Bid/ask spreads for Exchange Traded Managed Funds (ETMFs) or Active ETFs are higher because there is only one market maker (i.e. the responsible entity) and less competition between multiple market makers.
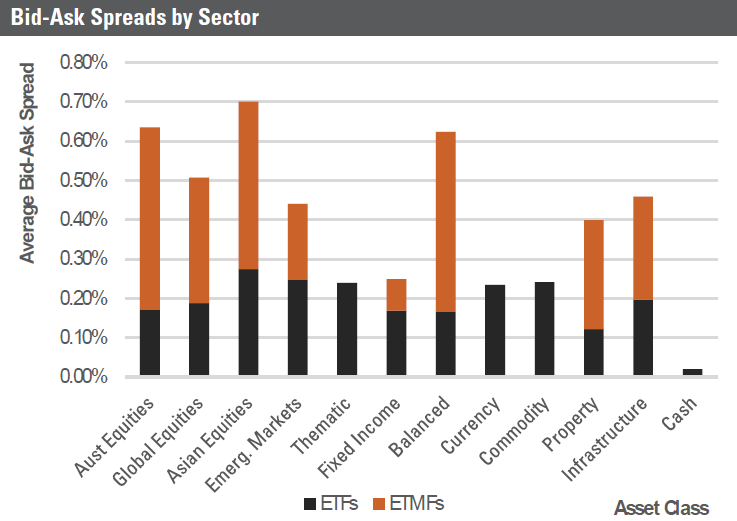
The chart below highlights two key patterns:
1) Australian-based ETFs (i.e., ETFs based on Australian securities) are characterised by the thinnest bid/ask spreads and in equities the spreads are largest for Asian and Emerging Markets mandates (some underlying markets are relatively illiquid), and,
2) ETMFs are characterised by materially higher bid/ask spreads.
What determines a bid/ask spread?
There are a range of drivers that determines bid/ask spreads which investors may wish to consider in the same way they check fees. For example, at 1.2%, the highest bid/ask spread is approaching the management fees that applies to the particular ETF.
The five key drivers are:
1. Timing and liquidity
In the ETF world, average bid/ask spread is a widely-quoted metric for measuring liquidity. Despite its usefulness, the average bid/ask spread cannot entirely capture the complexity of the ETF markets. One of its major downfalls is that it obscures the significant intraday variation that can exist in an ETF’s bid/ ask spread. Good or bad timing of trading can lead to a major variation in spreads incurred.
While supply and demand vagaries will impact actual intra-day levels, there is a distinct U-shaped pattern in ETF bid/ask spreads during the trading day for ETFs based on Australian equities. Specifically, there are elevated bid/ask spreads at the opening of the trading day (10:00 to circa 10:09am) and then taper during the trading day and then increase again in the after-market close ‘auction’ (circa 4:00 to 4:10pm).
For Australian equities-based ETFs, stocks open progressively from 10:00 to 10:09am based on ASX ticker alphabetical order. Until all stocks in a given portfolio are open and have traded, market makers are ‘flying blind’ to a degree on the NAV of the portfolio. This additional risk is reflected in wider bid/ask prices.
A similar dynamic exists for Asian equities-based ETFs, with spreads typically wider during Australian trading morning hours while Asian markets are pre-open and then typically taper as Asian equities markets open.
For broad global equities mandates or Europe or US-specific equities, the intra-day pattern is less distinct or not materially present at all as these markets are generally closed for the duration of ASX trading hours. ETFs are priced by the market maker by using appropriate futures contracts.
2. Internal market making
Product issuers generally appoint an independent third party that is a market participant to act as lead market maker to fulfil their liquidity obligations. However, in specific circumstances, licensed exchanges may allow the issuer to adopt the role of market maker (i.e. an internal market-making arrangement) on the fund’s behalf.
Issuers typically seek internal market making arrangements if there is a concern others will use their portfolio selections (their intellectual property or IP) by replicating the investment strategy to the ETF’s detriment. Internal market making arrangements are commonly used for ETMFs (or Active ETFs).
These funds operate under ASIC's INFO 230, designed to manage market integrity risks associated with internal market making. While ETMFs typically have materially higher bid/ask spreads, the profits and losses from such activities are channelled back into the NAV of the ETMF. Nevertheless, it remains a cost to the particular investor that is trading.
The main reason bid/ask spreads in ETMFs are higher than ETFs is because there is only one market maker (i.e. the responsible entity). On the other hand, an ETF that has an external market making arrangement has a primary market that allows multiple market makers and authorised participants. This promotes
competition and tighter spreads.
It should also be noted that the applicable average bid/ask spreads in ETMFs may well be approximately comparable to a fund manager’s unlisted unit trust version of the listed strategy.
3. Activity and trading volumes
If the ETF is popular and trades with robust volume, then bid/ask spreads tend to be narrower. ETFs that are thinly traded, or if the underlying securities of the fund are highly illiquid, can lead to wider spreads.
Market makers prefer larger ETFs with larger trading volumes. Ironically however it is in the less traded ETFs that investors are most requiring of a contracted market maker. VanEck, which has a contracted market maker for all its ETFs and ETMFs, suggests for smaller ETFs that financial advisers check whether there is a contracted market maker and whether the ETF issuer monitors the spreads on a intra-day basis (a check done by calling the ETF issuer).
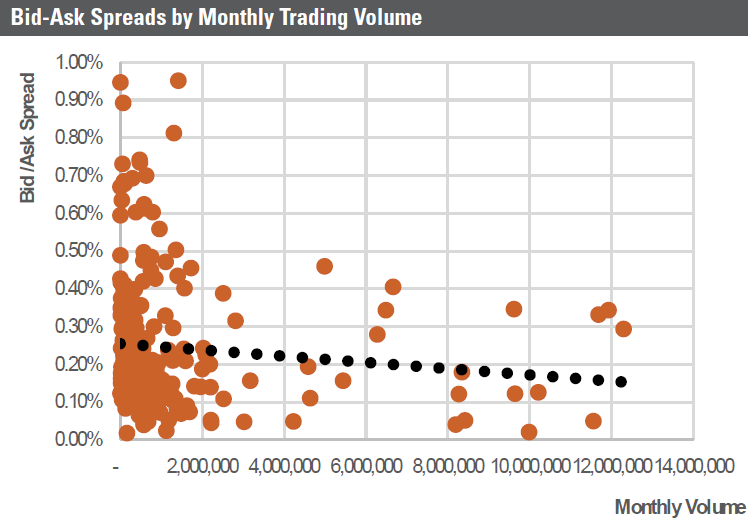
The chart above details bid/ask spreads by monthly trading volumes. The correlation is somewhat thrown askew by the inclusion of ETMFs but there is a positive correlation between higher volumes and lower bid/ask spreads.
4. Risk and information in the underlying portfolio
Risk and information relates to the pricing transparency in the underlying portfolio constituents. If a market is not open during a part or all of Australian trading hours, then there is a lesser degree of pricing transparency on the constituent stocks (notwithstanding the ability of a market maker to partly hedge through the use of futures). This lack of transparency tends to be greatest in more illiquid emerging markets.
Nevertheless, the use of futures is a proxy and implicitly creates an additional level of risk for market makers and which is reflected in broader spreads. Investors should not consider this a weakness of international equities ETFs or more niche based thematic ETFs, rather simply a practical reality relating to the additional risk taken by market makers.
5. Competition
Competition simply relates to the number of contracted market makers present. A contracted market maker (external or internal) must be present 'in the screen' at least 80% of the time between 10:15am and 4pm on a trading day. Contracted market makers (or more accurately, APs) are also bound by a maximum bid/ask spread. The more contracted market makers, the greater the assurance an investor has that spreads will not blow out.
The ASX provides a useful page here, which shows the number of market makers present in each particular ETF / ETMF and a schedule that details:
1) the minimum volume they must offer in the screen, and
2) the maximum bid-ask spreads. These maximum spreads relate to all market conditions, capturing differences in volatility (spreads will generally widen in more volatile market environments) and trading volumes. It is generally regarded by product issuers that the maximum levels will rarely, if ever, come to bear in practice.
In summary, don't assume the buy and sell price spreads of all ETMFs and ETFs are the same. Some come with high spreads, which adds to transaction costs which most investors overlook.
Rodney Lay is an Analyst at Risk Return Metrics. This article is general information and does not consider the circumstances of any individual.