Register For Our Mailing List

Register to receive our free weekly newsletter including editorials.

Home / 86

Good active managers are hard to identify

Standard & Poor's undertakes a semi-annual review of the performance of actively-managed funds compared with S&P indexes, and the June 2014 ‘SPIVA Australia Scorecard’ was recently released. The Scorecard measures both equal weighted (where every active fund is given the same weighting) and asset weighted (where a fund’s weight depends on its assets) returns from actively-managed funds.

It’s important to know some limitations of the SPIVA Scorecard. Actively-managed fund returns are measured after expenses, whereas index returns have not had investment fees deducted, which exaggerates the returns achievable from following a hypothetical index. Also, some indexes used in the scorecard, such as bond indexes, may not be easily replicable. The Scorecard only utilises five highly aggregated fund categories that can be lined up with available comparator benchmark indexes.

Overall, active funds struggle to beat index

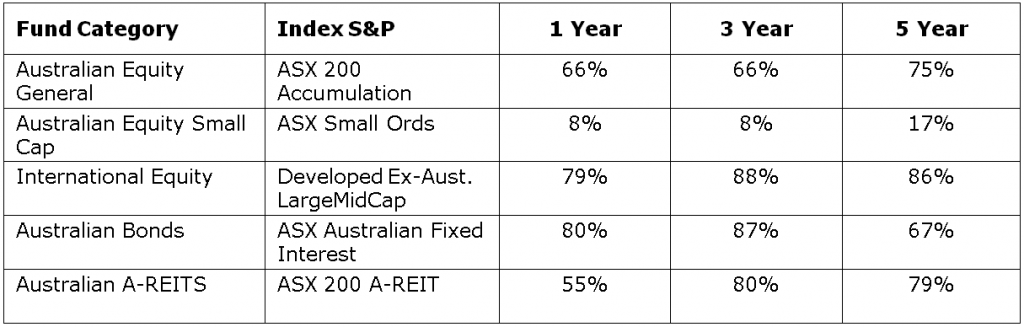
The Scorecard finds that the majority of actively-managed funds failed to beat their comparable benchmark indices over a one, three or five year period. In Australian equities, the mainstay of most Australian portfolios, the underperformance of actively-managed funds against the comparator index was reasonably consistent across one, three and five year periods at 66%, 66% and 75% respectively.

The only exceptions in performance versus index are actively-managed small cap funds, the clear majority of which beat their comparable indexes across all time periods.

Summary Table: Percentage of actively-managed funds outperformed by their comparable index

Index versus fund performance and survivorship

Taking a look at the percentage returns across the five asset categories:

a)  Australian Equity General Funds

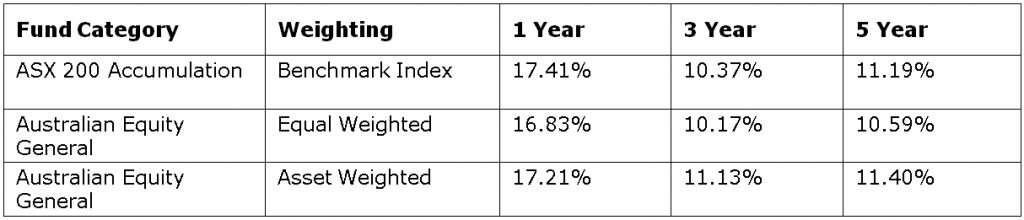
Contrary to popular belief, the findings suggest large funds in Australian equities have better returns than smaller ones, because the asset weighted returns were higher than the equivalent equal weighted returns across one, three and five years by 0.38%, 0.96% and 0.81% respectively.

81% of managed funds in this group survived the five year period.

b)  Australian Equity Small-Cap Funds

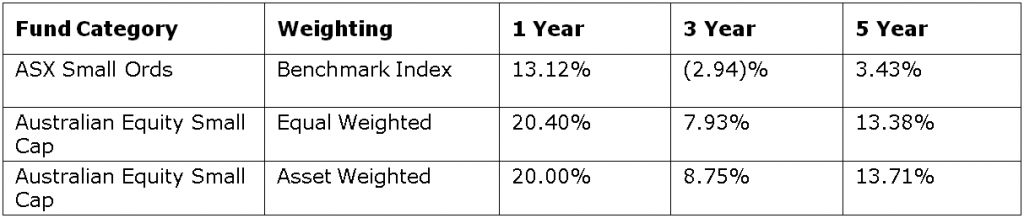
Only 8% of small cap funds failed to beat their comparator indexes across a one or three year period, and 17% across a five year period. Over all periods the investment returns from actively managed small cap funds held a massive lead over the comparator index.

83% of funds in this group survive the five year period, the highest of all the groups used in the Scorecard.

c)  International Equity General Funds

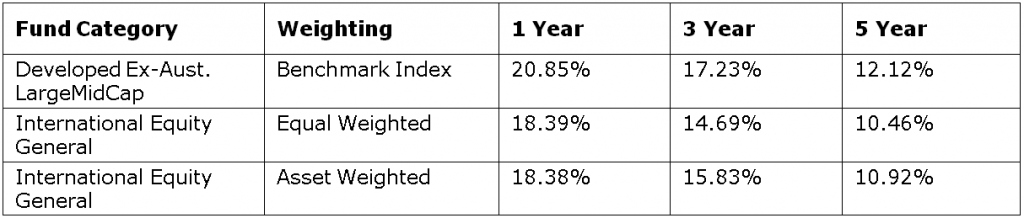
Only 78% of funds in this group survived more than five years, the lowest survivorship recorded of the groups used in the scorecard. The first Summary Table above showed the percentage of actively-managed international equity funds failing to beat the index was the highest of any asset class across one, three and five years at 79%, 88% and 86%. When 8 or 9 out of every 10 managed funds fails to beat their index, it suggests the markets are so well researched that it’s tough to gain an edge after fees.

d)  Australian Bond Funds

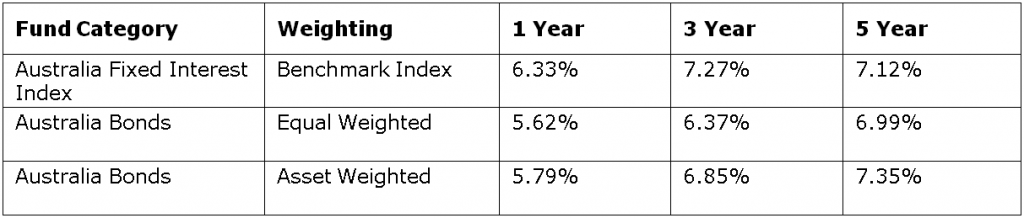
Bond indexes are also not truly replicable which limits the useability of the data. Over a five year period the performance return difference of around 0.2% between a bond fund and a hypothetical bond index is extremely small, considering fees have not been deducted from the hypothetical bond index. Managed bond funds had a survivorship rate of 82% for a five year period. The Summary Table above showed the percentage of managed bond funds failing to beat their index respectively across one, three and five years was 80%, 87% and 67%.

e)  Australian Equity A-REIT Funds

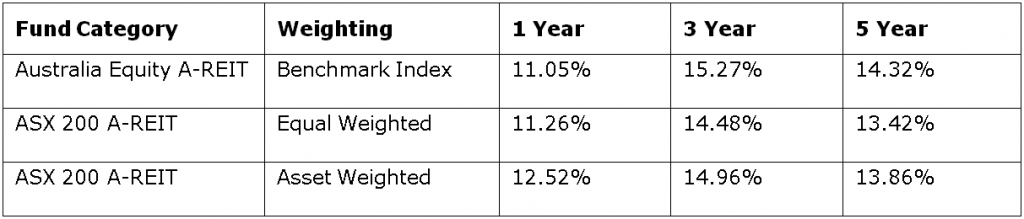
The A-REIT index recorded the strongest investment return over a five year period of all the asset classes at 14.32%. Asset weighted returns were above equal weighted returns suggesting that larger A-REITS perform better than smaller ones. Over a five year period 79% of A-REIT funds survived, which is lower than the survivorship rates of either domestic equity or bond funds. The Summary Table showed the percentage of actively managed A-REIT funds that failed to beat their comparator index across one, three and five year periods was 55%, 80% and 79%.

Tough finding good active managers

The SPIVA numbers once again demonstrate how difficult it is to identify active managers who justify their fees, other than in the small cap space. While no doubt there are talented asset managers who do outperform their index, by far the majority do not. The challenge for the investor who wants alpha above the market beta is to find a way to identify the minority of managers who add value over time. Many can do it for a short period, but investing is a long term activity.


Les Goldmann has over 20 years’ experience as a Chartered Accountant, and his roles have included freelance journalism, shareholder advocacy for the Australian Shareholders Association and senior roles in the commercial and non-profit sectors.


3 Comments
Ramani
October 31, 2014

Predicting the past is bad enough, let us not go near the future. It will come, anyway.

A contrary perspective awaits if we mandate every manager who trumpets its superior performance ('due to our outstanding skills', of course) is forced by law to equally publicise its woeful performance ('due to volatile markets, the GFC, the alignment of Saturn across the vernal equinox, everything but our skills-deficit', of course). If not. ASIC should do this for them and send them an invoice with a service fee and GST added.

Markets are like crowds. If frenzy overtakes them, authorities are powerless and will be stupid to get in the way. Those who get into markets active or passive must accept the risks. Marketers downplay them while analysts make a living out of them using the rare quality of 20:20 hindsight.

Erich Sehgal's "Class of 64" starts with the Harvard Dean reminding the proud students that the medical profession has found plausible cures for a handful out of thousands of ailments. The rest by implication is placebo, ingested with large doses of faith. So it is with investments. Like language construction, active or passive, the message is unchanged.

Graham Hand
October 31, 2014

Jason, thanks for the comment but I take exception to your final sentence. Cuffelinks is supported by both active and 'passive' managers, and in Chris Cuffe's covering note, he said his personal belief is that it is possible to pick active managers who outperform. We're not taking sides here, we're reporting the work of authorities in the market for our readers to make up their own minds. We have a highly diverse set of supporters - we'd need to disclose some interest on every article if we go down that path.

Jason
October 31, 2014

So why does the number 1 performing Industry super fund in Australia over a 10, 5 year and 1 year time frame put it's performance down solely to the selection of active fund managers. For the majority of do it yourself investors you're better off sticking to passive investors and get sub standard returns. Perhaps if you're really worried about fees just buying the big four banks, telstra and BHP and you've replicated the Australian market. But for me I've been an adviser for 15 years and use both active and passive managers and have outperformed the best performing super funds over the last 10 years by selecting a combination of active managers with some passive managers added. Perhaps greater education around the selection of active managers is warranted. Nice disclosure also that a passive manager is a major supporter of this publication.


Leave a Comment:

RELATED ARTICLES

History suggests the Magnificent Seven are headed for a fall

Track if your fund manager is taking the best shot

What super funds and their fund managers now think

banner

Most viewed in recent weeks

Raising the GST to 15%

Treasurer Jim Chalmers aims to tackle tax reform but faces challenges. Previous reviews struggled due to political sensitivities, highlighting the need for comprehensive and politically feasible change.

100 Aussies: seven charts on who earns, pays, and owns

The Labor government is talking up tax reform to lift Australia’s ailing economic growth. Before any changes are made, it’s important to know who pays tax, who owns assets, and how much people have in their super for retirement.

Here's what should replace the $3 million super tax

With Div. 296 looming, is there a smarter way to tax superannuation? This proposes a fairer, income-linked alternative that respects compounding, ensures predictability, and avoids taxing unrealised capital gains. 

9 winning investment strategies

There are many ways to invest in stocks, but some strategies are more effective than others. Here are nine tried and tested investment approaches - choosing one of these can improve your chances of reaching your financial goals.

The rubbery numbers behind super tax concessions

In selling the super tax, Labor has repeated Treasury claims of there being $50 billion in super tax concessions annually, mostly flowing to high-income earners. This figure is vastly overstated.

With markets near record highs, here's what you should do with your portfolio

Markets have weathered geopolitical turmoil, hitting near record highs. Investors face tough decisions on valuations, asset concentration, and strategic portfolio rebalancing for risk control and future returns.

Latest Updates

Investment strategies

Finding income in an income-starved world

With term deposit rates falling, bonds holding up but with risks attached, and stocks yielding comparatively paltry sums, finding decent income is becoming harder. Here’s a guide to the best places to hunt for yield.

Economy

Fearful politicians put finances at risk

A tearful Treasury chief, a backbench rebellion, and crashing bonds. What just happened in the UK and why could Australia’s NDIS be headed for the same brutal fiscal reality?

Shares

Investing at market peaks: The surprising truth

Many investors are hesitant to buy into a market that feels like it’s already climbed too far, too fast. But what does nearly a century of market history suggest about investing at peaks?

Shares

Chinese steel - building a Sydney Harbour Bridge every 10 minutes

China's steel production, equivalent to building one Sydney Harbour Bridge every 10 minutes, has driven Australia's economic growth. With China's slowdown, what does this mean for Australia's economy and investments?

Investment strategies

Will stablecoins change the way we pay for things?

Stablecoins have been hyped as a gamechanger for the payments industry. But while they could find success in certain niches, a broader upheaval of Visa and Mastercard's payments dominance looks unlikely.

Infrastructure

An investing theme you can bet on for the next 30 years

Investors view infrastructure as a defensive asset class rather than one with compelling growth prospects. These five tailwinds for demand over the coming decades suggest that such a stance could be mistaken.

Investment strategies

A letter to my younger self: investing through today's chaos

We are trading through one of history's most confounding market environments. One day, financial headlines warn of doomsday scenarios. The next, they celebrate a new golden age. How can investors keep a clear head?

Sponsors

Alliances

© 2025 Morningstar, Inc. All rights reserved.

Disclaimer
The data, research and opinions provided here are for information purposes; are not an offer to buy or sell a security; and are not warranted to be correct, complete or accurate. Morningstar, its affiliates, and third-party content providers are not responsible for any investment decisions, damages or losses resulting from, or related to, the data and analyses or their use. To the extent any content is general advice, it has been prepared for clients of Morningstar Australasia Pty Ltd (ABN: 95 090 665 544, AFSL: 240892), without reference to your financial objectives, situation or needs. For more information refer to our Financial Services Guide. You should consider the advice in light of these matters and if applicable, the relevant Product Disclosure Statement before making any decision to invest. Past performance does not necessarily indicate a financial product’s future performance. To obtain advice tailored to your situation, contact a professional financial adviser. Articles are current as at date of publication.
This website contains information and opinions provided by third parties. Inclusion of this information does not necessarily represent Morningstar’s positions, strategies or opinions and should not be considered an endorsement by Morningstar.