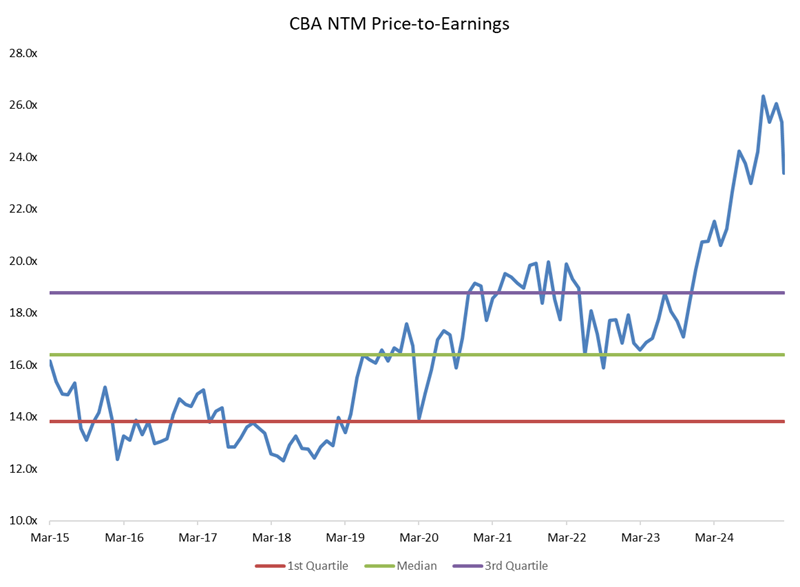
The banking sector enjoyed an extraordinary rally in 2024, with the Big Four Banks delivering an average total shareholder return of 33%. As recently as February, Commonwealth Bank (CBA), for instance, enjoyed a price to earnings multiple of 26x- a 60% premium to its historical average. This raises an important question: are these valuations justified for a sector that has not grown its overall earnings per share over the last 10 years?
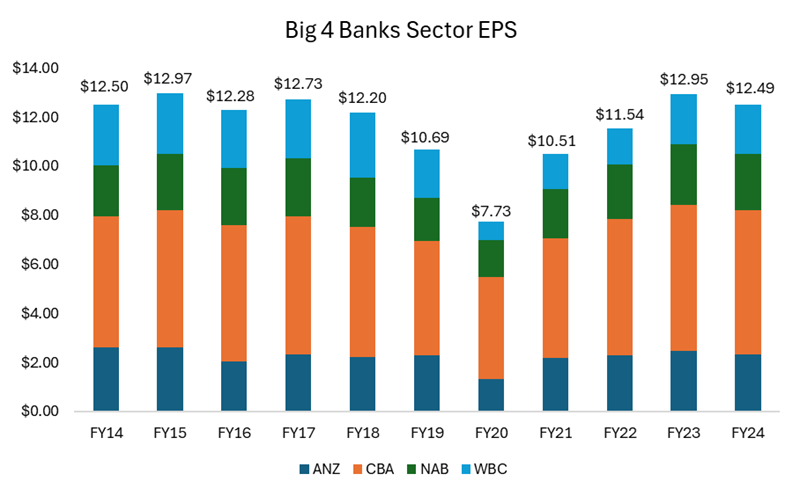
To look at this in another way, you can see in the chart below that the collective earnings of the Big Four are only today back to where they were in 2018. Yet if we add up the cumulative share prices of the banks, you’re paying $233 in total for all four banks versus $157 in 2018 for the same level of earnings. And this is after the recent share price rout; at the banks’ peak in February, you would have paid a cumulative $276 for these earnings.
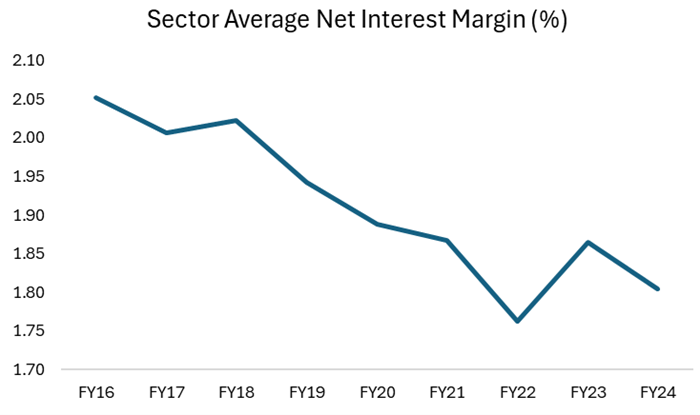
Are banks really making more money? The net interest margin story
At its core, banking profitability hinges largely on a single key metric: Net Interest Margin (NIM). This is the difference between what a bank earns on loans and what it pays on deposits. The higher the margin, the more profitable the bank.
However, over the past few decades, this margin has been steadily shrinking. This decline has been driven by three key structural changes in the industry:
1. Mortgage brokers
Over the past decade, the share of mortgage broker-originated loans has surged from ~50% to 75%, significantly squeezing bank margins. Banks pay the broker a large upfront commission of ~0.65% of the loan value ($6,500 for every $1 million lent) and a trailing commission of 0.15% per year. Moreover, because brokers focus on securing the lowest possible rate for customers, mortgages have become increasingly price-driven, reducing banks’ ability to charge more favourable rates. Since brokers earn their largest commission when writing a new loan, they have an incentive to refinance customers regularly, which further erodes bank margins. The Commonwealth Bank estimates that the broker channel is 20-30% less profitable than a loan originated through a bank’s proprietary channel.
2. Entrance of Macquarie
Over the last decade, Macquarie Group has entered the banking sector, employing a digital, broker-led model where it can operate a lean model without the tech debt and branch costs of its traditional competitors. The company has successfully grown its share to ~5% and its ease of use has made it popular with brokers. Unlike the major banks, Macquarie doesn’t need to maintain a constant presence in the mortgage market. It has entered when risk and pricing are attractive and exited when margins tighten, making it a highly agile competitor. This dynamic prevents periods of excess profitability for the Big Four, as Macquarie re-enters the market whenever rates become too favourable for banks.
3. Exit from broader business lines
In the past, banks operated in higher-margin businesses such as wealth management and insurance. While these divisions may have distracted them from mortgage competition, they also provided additional profitability. With banks now exiting these areas, mortgage lending has become their primary battleground, intensifying competition and further pressuring margins.
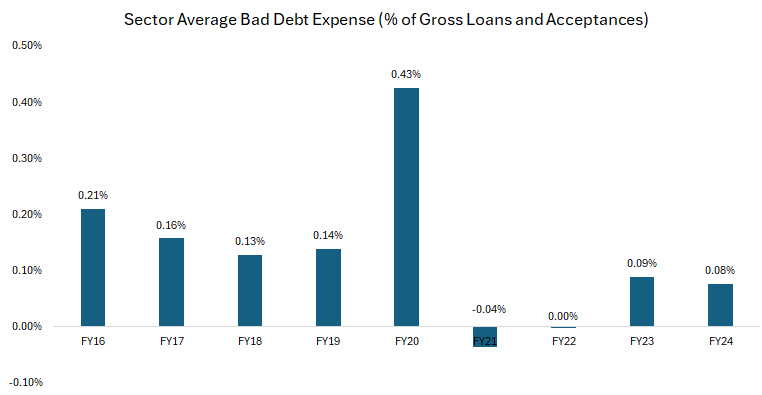
Bad debts are low but can this last?
One of the biggest risks for any bank is loan defaults, which result in bad debt expenses; that is, the losses banks take when borrowers can't repay their loans. Historically, Australian banks have averaged bad debt expenses of ~0.15% to 0.20% of gross loans and acceptances.
In FY24, this figure was just 0.08% – about half the long-term average. While this looks like a positive for bank earnings, the key question is: is this sustainable?
Why are bad debts so low right now?
There are three key reasons bad debt expenses remain unusually low:
- Favourable economic conditions. Strong employment and rising house prices mean most borrowers can still meet their repayments. Even if someone loses their job, they can often sell their home at a premium, allowing the bank to recover the loan without taking a loss.
- Covid-era provisions act as a buffer. During the pandemic, banks set aside large provisions for expected loan losses that never fully materialised. These reserves have been gradually released, reducing reported bad debt expenses in recent years.
- Shift towards lower-risk lending. Some argue that historical bad debt levels aren’t as relevant today because banks now focus more on residential mortgages rather than riskier business lending, which traditionally had higher default rates.
The real risk: Are banks underestimating future loan losses?
While bad debts are currently low, history suggests this won’t last forever. Since current bank earnings are inflated by unusually low bad debt expenses, it’s reasonable to assume:
- Future earnings may be overstated at today’s valuations.
- A normalisation of bad debts could reduce bank profitability more than expected.
Bottom line? The current low levels of bad debts make bank earnings look better than they likely are in the long run, suggesting investors should be cautious about assuming today’s profits are sustainable. To pick on ANZ as an example – and we chose ANZ because it has the lowest level of provisioning for bad debts – if the bad debts expense were to normalise to ~0.20% of gross loans and acceptances (the pre-covid FY16-19 average) from 0.05% in FY24, its EPS would have been ~13% lower.
Expenses
One area where banks could justify a higher valuation is through improved efficiency. However, the track record here is mixed. While banks have closed physical branches and pushed digital banking, these savings have been offset by rising IT spending, cybersecurity costs and regulatory compliance. Additionally, employee expenses account for ~70% of a bank’s cost base and wage pressures remain high. The net result? Banking cost bases have proven resilient, making it difficult for them to structurally improve profitability through expense reduction.
Since FY16, bank expenses have grown at ~1.7% p.a. compared to income growth of just 0.9% p.a.
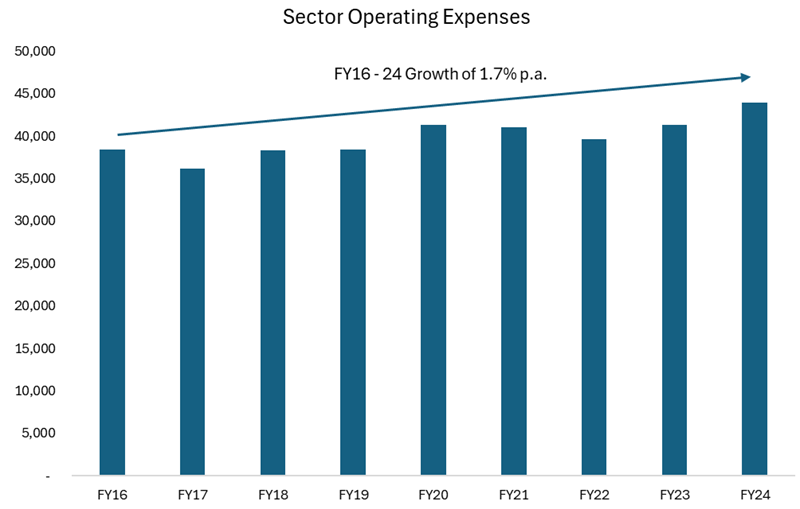
This means that despite cost-cutting efforts, banks struggle to convert these savings into higher profits because any efficiency gains are competed away in lower prices for customers. As a result, cost-cutting alone is unlikely to drive meaningful margin expansion at the sector level.
Over time cost efficiencies (lower cost-to-income (CTI) ratio) have been reinvested back in the customer
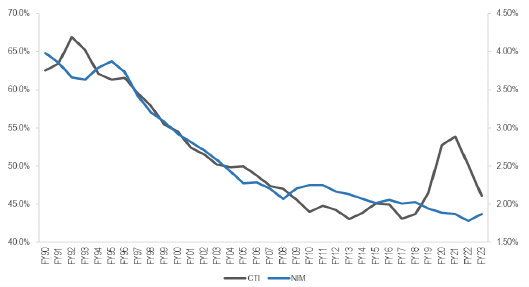
Source: JP Morgan
Are bank valuations justified?
The 2024 banking rally may suggest a thriving sector, but the fundamentals tell a different story:
- Net interest margins remain under pressure as mortgage brokers dominate the market and Macquarie intensifies competition.
- Bad debt expenses are at historic lows, but history suggests they will normalise over time, reducing earnings.
- Cost-cutting has failed to translate into sustained profitability, with banks reinvesting savings into lower prices to stay competitive.
- Volume growth will remain moderate, given Australia has one of the highest household debt-to-GDP ratios globally.
Given these challenges, the current high bank valuations appear disconnected from long-term earnings potential.
Jack McNally is an Equities Analyst at Magellan-owned, Airlie Funds Management. Magellan Asset Management is a sponsor of Firstlinks. This article has been prepared for general information purposes only and must not be construed as investment advice or as an investment recommendation. This material does not consider your investment objectives, financial situation or particular needs.
For more articles and papers from Magellan, please click here.