Register For Our Mailing List

Register to receive our free weekly newsletter including editorials.

Home / 277

Three key issues with S&P’s index v passive scorecard

S&P Dow Jones Indices recently released its updated Index Versus Active (SPIVA) Australian Scorecard covering fund manager versus index performance to June 2018.

The results of the analysis have again found that, with the exception of small-cap equities, the average Australian actively-managed fund underperformed comparable market indexes over the 1-year and longer periods. That is, more than 50% of active funds underperformed the index.

Unfortunately, the S&P SPIVA analysis is not comparable to, and is therefore irrelevant for, institutional superannuation funds, and may be for some individual investors.

Three key problems with the analysis

If we take Australian equities as an example (general or large-cap style), there are three problems:

1. Managers

The SPIVA analysis is based on over 300 actively-managed funds defined by Morningstar as large-cap. It is not disclosed how many managers actually manage these 300 funds.

From an institutional perspective, there are probably less than one-third that number of large-cap managers and strategies that would even be considered as potential investments, due to the tight compliance and eligibility rules they use.

2. Equal versus asset weightings

S&P Dow Jones Indices does publish some asset-weighted results (that is, weighting the results by funds under management, not giving equal weights to tiny and large fund managers) in the SPIVA. However, the tables of results which are the sources of the outperformance comparisons over 1, 3, 5, 10 and 15 years showing that x% of funds underperform the benchmark are based on equal-weighted returns. A manager with a small portfolio is given the same weight as one with many billions.

Notably, in the tables in the SPIVA Report which give both equal and asset-weighted return levels, the asset-weighted active funds outperform the equal-weighted funds by 30-50 basis points per annum. This suggests that either:

  • larger investors are able to select better-performing actively-managed funds, and/or
  • larger actively-managed funds have lower fee levels.

In either case, the asset-weighted funds would have had better performance relative to the index over time if these figures had been used for the outperformance comparisons.

3. Retail fees

The SPIVA analysis is based on fund performance provided by Morningstar, which are after-fee returns. Given the large number of funds (over 300), many have 'retail' fee levels. Moreover, even those ‘wholesale’ funds included would have fee levels significantly greater than those paid by institutional superannuation funds investing through mandates, and some options accessible by retail.

The charts in the SPIVA analysis which show cumulative (growth of a dollar) performance versus the benchmark show clear outperformance by the asset-weighted funds over the equal-weighted across essentially all periods, and for all asset classes (with the notable exception of small-cap funds). This indicates that larger investors select better performing investments.

Adjusting the results

If the SPIVA analysis was adjusted to reflect an institutional manager selection process and institutional fee levels, it would be likely that the average super fund investor would be found to consistently outperform the benchmark.

Actual results delivered by Australian super funds support this conclusion, with the SuperRatings SR50 Australian Shares Index of after-fee (i.e. actual) returns to super fund members outperforming the S&P/ASX 200 index (before fees) in every period (1, 3, 5, 10 and 15 years).

S&P Dow Jones Indices claim that they are ‘the de facto scorekeeper of the ongoing active versus passive debate’. It should be born in mind that the SPIVA Scorecard is only relevant to retail investors, and even there, should be qualified by the above analysis.

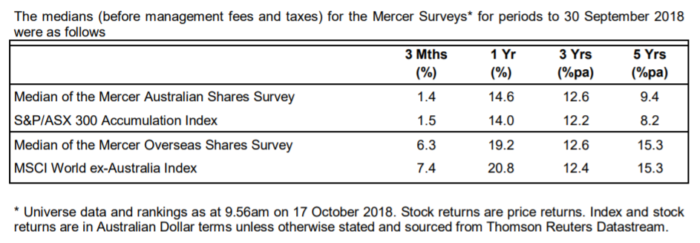
[Editor's note: The SPIVA data is often quoted to demonstrate active manager underperformance, but it is not the only company which monitors managers. The latest Mercer Investment Survey results were recently released for September 2018, as shown below. Perhaps supporting John Peterson's analysis, Mercer shows the median Australian shares manager outperformed the S&P/ASX300 by 1.2% (9.4% versus 8.2%, before fees) over five years. Even after fees, this result is likely to show outperformance].


John Peterson is the Founder of Peterson Research Institute Pty Ltd and has 40 years of experience in the financial services and investment industry. The views and opinions expressed in this article are those of the author. This article is provided for general information only and does not constitute financial or any other advice.

  •   23 October 2018
  • 4
  •      
  •   
banner

Most viewed in recent weeks

Retirement income expectations hit new highs

Younger Australians think they’ll need $100k a year in retirement - nearly double what current retirees spend. Expectations are rising fast, but are they realistic or just another case of lifestyle inflation?

Four best-ever charts for every adviser and investor

In any year since 1875, if you'd invested in the ASX, turned away and come back eight years later, your average return would be 120% with no negative periods. It's just one of the must-have stats that all investors should know.

Why super returns may be heading lower

Five mega trends point to risks of a more inflation prone and lower growth environment. This, along with rich market valuations, should constrain medium term superannuation returns to around 5% per annum.

The hidden property empire of Australia’s politicians

With rising home prices and falling affordability, political leaders preach reform. But asset disclosures show many are heavily invested in property - raising doubts about whose interests housing policy really protects.

Preparing for aged care

Whether for yourself or a family member, it’s never too early to start thinking about aged care. This looks at the best ways to plan ahead, as well as the changes coming to aged care from November 1 this year.

Our experts on Jim Chalmers' super tax backdown

Labor has caved to pressure on key parts of the Division 296 tax, though also added some important nuances. Here are six experts’ views on the changes and what they mean for you.        

Latest Updates

A speech from the Prime Minister on fixing housing

“Fellow Australians, I want to address our most pressing national issue: housing. For too long, governments have tiptoed around problems from escalating prices, but for the sake of our younger generations, that stops today.”        

Taxation

Family trusts: Are they still worth it?

Family trusts remain a core structure for wealth management, but rising ATO scrutiny and complex compliance raise questions about their ongoing value. Are the benefits still worth the administrative burden?

Exchange traded products

Multiple ways to win

Both active and passive investing can work, but active investment doesn’t in the way it is practised by many fund managers and passive investing doesn’t work in the way most end investors practise it. Here’s a better way.

Economy

The Future Fund may become a 'bad bank' for problem home loans

The Future Fund says it will not be paying defined benefit pensions until at least 2033 - raising as many questions as answers. This points to an increasingly uncertain future for Australia's sovereign wealth fund.

Investment strategies

Managed accounts and the future of portfolio construction

With $233 billion under management, managed accounts are evolving into diversified, transparent, and liquid investment frameworks. The rise of ETFs and private markets marks a shift in portfolio design and discipline. 

Property

Commercial property prospects are looking up

Commercial property is seeing the same supply issues as the residential market. Given the chronic undersupply and a recent pickup in demand, it bodes well for an upturn in commercial real estate prices.

Infrastructure

Private toll roads need a shake-up

Privatised toll roads in Australia help governments avoid upfront costs but often push financial risks onto taxpayers while creating monopolies and unfair toll burdens for commuters and businesses.

Sponsors

Alliances

© 2025 Morningstar, Inc. All rights reserved.

Disclaimer
The data, research and opinions provided here are for information purposes; are not an offer to buy or sell a security; and are not warranted to be correct, complete or accurate. Morningstar, its affiliates, and third-party content providers are not responsible for any investment decisions, damages or losses resulting from, or related to, the data and analyses or their use. To the extent any content is general advice, it has been prepared for clients of Morningstar Australasia Pty Ltd (ABN: 95 090 665 544, AFSL: 240892), without reference to your financial objectives, situation or needs. For more information refer to our Financial Services Guide. You should consider the advice in light of these matters and if applicable, the relevant Product Disclosure Statement before making any decision to invest. Past performance does not necessarily indicate a financial product’s future performance. To obtain advice tailored to your situation, contact a professional financial adviser. Articles are current as at date of publication.
This website contains information and opinions provided by third parties. Inclusion of this information does not necessarily represent Morningstar’s positions, strategies or opinions and should not be considered an endorsement by Morningstar.