Australian equities fell during the June quarter with the S&P/ASX 200 Accumulation Index down 1.6%. However, for the 12 months to 30 June 2017 the index was up 14.1% driven by a good performance from large caps and strong gains in the resources sector with the S&P/ASX 200 Materials Index up 25.8%. Small caps slightly outperformed the broader market in the June quarter but the ASX Small Ordinaries Accumulation Index was still down 0.3% for the quarter. Small caps underperformed over the past 12 months with the index up 7.0% for the 12 months. There appears to be some value in the small cap sector, with a number of small cap managers viewing the market as slightly undervalued relative to large caps.
LICs
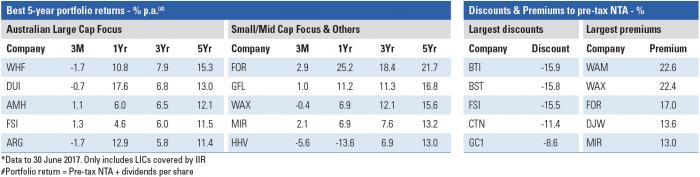
Some value amongst the large cap LICs
The Australian large cap share focused LICs benefited from the solid market performance over the past 12 months with the five largest LICs delivering an average portfolio return (pre-tax NTA plus dividends) of 11.5%. This was below the S&P/ASX 200 Accumulation Index return of 14.1% and largely reflects underweight positions in resources. Over the medium to long-term we expect the Australian large cap share focused LICs to perform broadly in line with the market.
For investors seeking exposure to the Australian large cap market sector, the three largest LICs in this sector, Australian Foundation Investment Company (ASX:AFI) Milton Corporation (ASX:MLT and Argo Investments (ASX:ARG) offer reasonable value trading at or slightly below pre-tax NTA at 30 June 2017 compared to their three-year average premiums to pre-tax NTA. The shares are currently offering fully franked dividend yields of 4% or better. We have a Highly Recommended rating on all three LICs.
Australian United Investments (ASX:AUI) and Diversified United Investments (ASX:DUI) were the top two performing LICs in our coverage over the past 12 months delivering portfolio returns of 18.0% and 17.6% respectively, the overall market return. These two LICs have benefited from overweight positions in some of the major banks, CSL and RIO. DUI has also been one of the best performing large cap LICs over the past five years as shown in the above table. Historically, AUI and DUI have traded at a discount to pre-tax NTA. However, at 30 June 2017 their discounts of 5.6% and 7.0% are slightly higher than their three year average discount as shown in the following data tables. Our rating for AUI is Recommended Plus and our rating for DUI is Recommended. Investors should be aware that DUI also has some exposure to international equities with up to 10% able to be invested in international markets via ETFs.
Aberdeen Leaders (ASX:ALR) also performed strongly over the 12 months to 30 June 2017 outperforming the broader market with a portfolio return of 14.9%. The portfolio benefited from overweight positions in CSL, RIO and AGL. Over the longer-term ALR has underperformed the S&P/ASX 200 Accumulation Index. At the end of June, ALR was trading at a 7.9%% discount to pre-tax NTA in line with its three-year average. Our rating for ALR is recommended.
Small caps underperform the broader market
Excluding two outliers that delivered significant negative returns, the average return for small cap focused LICs for the 12 months to 30 June 2017 was 7.6%, slightly above the ASX Small Ordinaries Accumulation Index return of 7.0%. The small cap index significantly underperformed the broader market return.
Forager Australian Shares Fund (ASX:FOR) was the best performing small cap focused entity in our coverage over the 12 months to 30 June 2017, with the company benefiting from a strong weighting to the recovering mining and mining services sectors. As the table above shows, FOR has also been the best small/micro-cap focused performer over the past five years (including pre-listing data) delivering an outstanding portfolio return of 21.7% p.a. Since inception, the high conviction strategy and concentrated portfolio approach has delivered strong returns, with the portfolio outperforming the S&P/ASX All Ordinaries Accumulation Index by 7.5% p.a. Our rating for FOR is Recommended Plus however, as the above table shows the units were trading at a 17% premium to NTA at 30 June 2017. We would prefer to buy the units closer to NTA. Westoz Investment Company (WIC) was another small-cap focused entity to benefit from the strong resources sector, delivering a portfolio return of 13.5% for the 12 months to 30 June 2017. Whether it can continue to perform well depends on the outlook for resources and the resources based West Australian economy. Over the past five years WIC has delivered a portfolio return of just 2.2% p.a. despite the strong returns of the past 12 months. Our rating for WIC is Recommended.
WAM Capital (ASX:WAM) delivered a portfolio return of 9.6% for the 12 months, above the small cap index return of 7.0% but below its benchmark ASX All Ordinaries Accumulation benchmark return of 13.1%. As the table above shows, WAM Research remains the best of the Wilson Asset Management LICs over a five year period although over the past 12 months its portfolio return of 6.9% was below both the small cap index and the ASX All Ordinaries Accumulation Index returns. These LICs continue to trade at significant premiums to NTA. Whilst our recommendation for WAX is Highly Recommended and WAM is Recommended Plus, we would rather be patient acquirers of the shares at levels much closer to pre-tax NTA.
Strong performance from international shares
Returns from the international focused LICs were positive over the 12 months to 30 June 2017 with international markets performing well. This sector delivered an average portfolio return of 17.1% compared to the MSCI World Index (AUD) return of 14.7%. Emerging market focused LICs delivered a return of 14.5% against the MSCI Emerging Market return of 20.1%. With a number of market commentators suggesting that emerging markets look better value than a fully priced U.S. market, we could see further outperformance of emerging market shares in coming months. IIR covers two emerging market focused LICs/ LITs, Emerging Markets Masters Fund (ASX:EMF) which invests in a portfolio of emerging market funds and Asian Masters Fund (ASX:AUF) which invests in a portfolio of Asian Equity Funds. AUF has the ability to indirectly invest in China A-Shares through its manager selection. At the end of June EMF and AUF were trading at small premiums to NTA of 1.6% and 0.8% respectively. We have a Recommended Plus rating on both entities.
Peter Rae is Supervisory Analyst at Independent Investment Research. This article is general information and does not consider the circumstances of any individual.