Three recent reports on asset allocations reveal plenty of changes in investor activity during 2022. They confirm Exchange Traded Funds (ETFs) are winning market share from unlisted managed funds, but local investors are now favouring Australian exposure over global. While flows into ETFs and managed funds have some similarities, there are some surprising differences.
To recap on stockmarkets in 2022, for example, the largest ETF in Australia, the Vanguard Australian Shares Index ETF (ASX:VAS) with $11 billion in assets, was down 12% in the last three months and 10% calendar year-to-date (as shown below). It was up 17% in calendar 2021. However, the S&P500 was down 20% in the first six months of 2022, its worst first half for 60 years.
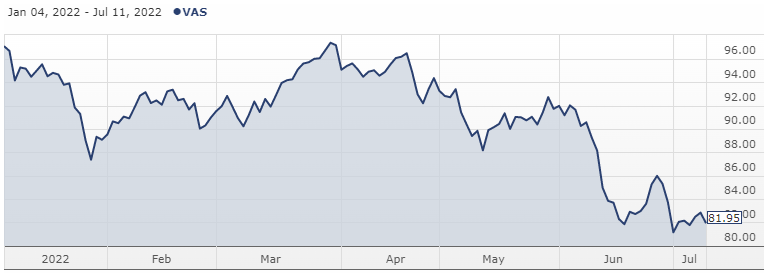
Source: Morningstar
Australian managed fund flows
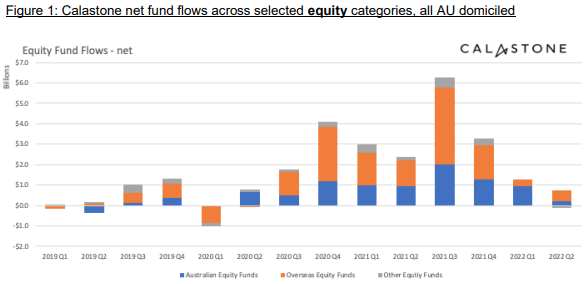
Following good net flows into managed equity funds of about $850 million in April and May 2022, by June, sentiment had turned sharply negative. Net outflows reached $250 million in the month of June 2022, with Australian equities rising marginally but global equities facing heavy withdrawals, according to Calastone’s Fund Flow Index. For the June 2022 quarter overall, net flows to managed equity funds fell to $600 million, versus a record $6.3 billion in the third quarter of 2021. As often happens, investors tend to commit money based on prior results, and market rises build confidence and justify optimism. Equity fund inflows then collapse as the market falls.
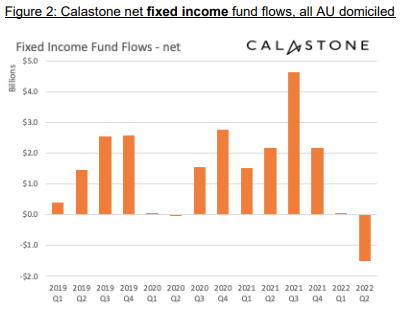
Fixed income funds fared even worse, and by June 2022, investors had withdrawn fixed income funds for four consecutive months. Net outflows were over $1.5 billion in the June quarter, mostly in June alone.
The above numbers are a good sample as more than 95% of Australian managed fund flows pass across the Calastone network.
Australian ETF flows
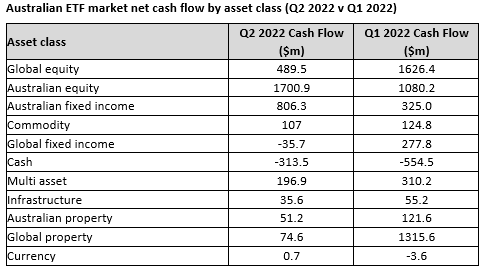
However, while Australian equity ETFs also did much better than global ETFs in the June 2022 quarter, fixed interest was much stronger, according to new data released this week by Vanguard and the ASX. Australian fixed income ETFs recorded $806 million in inflows, a significant increase over the first quarter. Cash ETFs were well down while global fixed income also saw outflows.
As with managed funds, Australian equity ETFs raised significantly more money than global equity, a reversal of flows in 2021. While investors have missed some of the gains from a declining AUD in unhedged global funds, the Australian market has performed much better than the US, which no doubt discouraged global allocations.
Global ETF flows
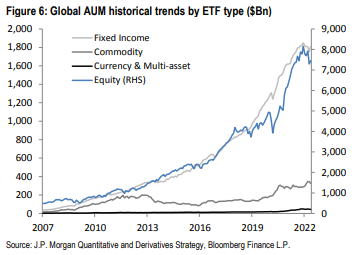
The third new report comes from JP Morgan and addresses funds flows in global ETFs. There are about 10,000 ETFs listed globally, up from 3,700 in a decade, now holding around US$10 trillion.
For many years after the first ETF was launched in 1990, they were based only on broad equity indices, but from about 2005, interest in non-equity ETFs started to grow. But equity ETFs still dominate, comprising 77% of global ETF assets, with fixed income at 19%, commodities at about 3% and others much smaller. Note this chart give equities a separate axis on the RHS.
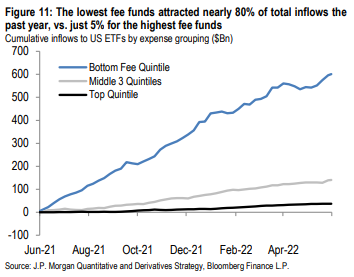
ETF fees are consistently falling, and most money continues to flow to passive investing and lower fee products. Average fees across all ETFs weighted by fund size is 0.18% (18 bps). While a burst of interest in thematic ETFs with higher fees in both 2021 and 2022 led to a brief fall in funds flows to the cheapest ETFs, the recent weaker performance of thematics has resumed the move to cheaper passive.
The poor relative performance of thematics in 2022 is dramatic, showing that investors attracted to the next hot sector in 2021 were setting themselves up to fail by overlooking investment fundamentals and traditional valuations.
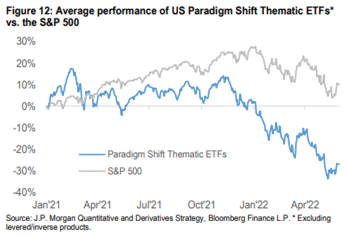
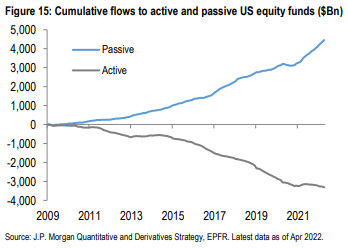
As the next big thing comes and goes, and active managers have great years and not-so-great years, passive investing continues to win favour.
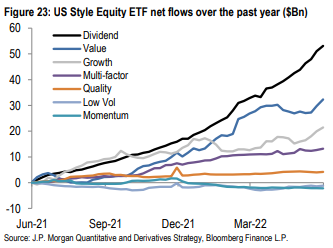
Specifically in the US, equity ETFs saw a record year of inflows at US$570 billion, with domestic equities gaining around three-quarters of the total. International was 19% and emerging markets 6%. Half the US flows were into broad large cap ETFs, generally into defensive sectors and out of cyclicals, with inflows to Health Care and bond proxy sectors (Real Estate, Staples, Utilities) and outflows from cyclical sectors (Financials, Industrials and Discretionary).
US 'style' funds were popular, making up 30% of the total. Dividend funds saw the strongest inflows followed by Value funds, while Low Vol and Momentum recorded net outflows.
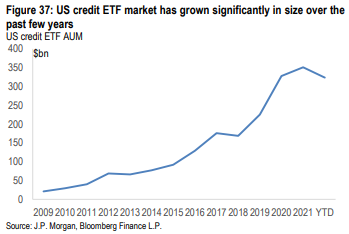
Still in the US, credit ETFs gained increasing acceptance as investors look for exposure to diversified bonds offering better returns. US credit ETF assets have increased 17% annually over the past 10 years to $328 billion as of May 2022, although they remain less than 4% of total credit market bonds outstanding. The recent fall in value is driven by rising rates and widening spreads.
The big global ETF trends
JP Morgan expects ETFs to take more market share of active management from unlisted managed funds, based on the ETF advantages of typically lower expenses, intraday liquidity and continuous pricing, and the ability to short and trade options. However, the dominance of passive funds is not likely to change, suggesting the growth in active ETFs will come at the expense of active managed funds.
Graham Hand is Editor-At-Large for Firstlinks. This article is general information and does not consider the circumstances of any investor.