Register For Our Mailing List

Register to receive our free weekly newsletter including editorials.

Home / 424

Longest positive run for Australian shares since WWII

August 2021 marked the longest run of consecutive positive months for the Australian share market since World War II. Although such long positive runs are unusual, they are by no means an automatic warning of imminent demise. Previous long positive runs for shares were not all followed by crashes or corrections, at least not immediately thereafter. However, the current run may end in September as healthy dividends leave company bank accounts.  

A strong sign of confidence

This particular measure is rather fickle, as a sustained run of positive (or negative) months can be broken by a miniscule negative (or positive) month caused by something which might be a completely random event. However, it does provide a general picture of overall market sentiment and confidence in the form of sustained bouts of optimism (or pessimism).

The main chart shows the steady upward march of the local share market over the past 150 years through booms and busts along the way. The lower section shows the runs of consecutive positive months (green bars) and runs of consecutive negative months (red bars).

Most of the time, the market drifts along, switching between short runs of up to three months at a time up or down. Every few years a more sustained run develops, and these are highlighted in the chart.
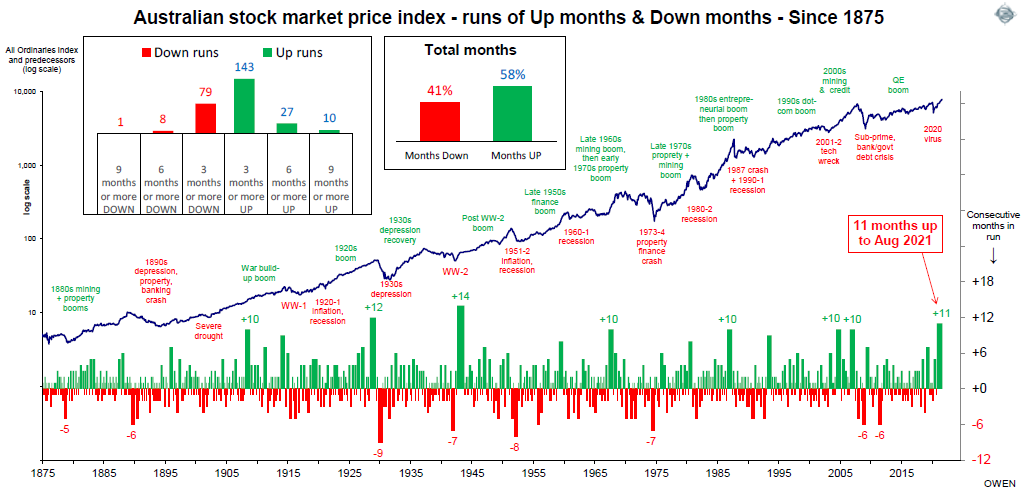
The longest positive run for shares in Australia was 14 months from April 1942 to September, 1943, when the market rose by 30% in the middle of World War II. Prior to the run, the market had fallen by -29% from September 1941 to the end of March 1942. The turning point for the War in the Pacific, and the trigger for the start of the share rebound, was General Macarthur's arrival in Australia as the Supreme Commander of Allied Forces.

The 14-month share rally was ended not by a correction but by a tiny -0.1% fall in October 1943, and prices then kept on rising more or less steadily to the end of the War. 

There have been several positive runs of 10 months for shares, including two during the 2003-07 China/credit boom, one in the mid-1980s takeover boom prior to the 1987 crash, one during the late-1960s mining/oil boom, and one during the post-Federation drought. There was also a 12-month positive run ending in May 1929 before the 1929-31 crash.

Negative runs fewer and shorter

On the other hand, runs of consecutive negative months for shares have been fewer and shorter than the positive runs. This is highlighted by the larger of the two insert charts in the main chart above.

The longest run of negative months was ‘just’ nine months from August 1929 to May 1930, when the broad market fell by -34%. That was essentially the first half of the -64% fall in the 1929-31 crash. 

Australian company profits surging back

The tremendous run of 11 consecutive months of gains in the local share market is likely to come to an end this month (September 2021) but the reason is that company profits and dividends are booming, not falling.

Company share prices will fall as they pay out unusually large dividends from the very strong reporting season to the end of June. If a company with a share price of say $20 pays a $1 per share dividend, the share price will fall by the amount of the dividend (plus or minus any other impacts on the company or the broad share market that day). The ‘total returns’ to shareholders are unchanged. The shareholder’s wealth is still the same $20 per share: $19 in the market value of the share after the dividend is paid out, plus the other $1 now in the shareholder’s pocket.

As this season's dividends will be the largest in history, investors will need to take extra care to redeploy the extra cash into productive investments, because cash is still returning zero.

The good news is that the bumper profit and dividend picture is well ahead of the targets to recover from the 2020 collapse, although we are still in lockdown (and probably back in economic contraction).

The next pair of charts are from our past reports to show the extent of this recovery. The left chart shows the steep decline in aggregate profits (maroon line) and dividends (green) in 2020, and it highlights the profit rebound target, high in the sky ahead. Aggregate profits fell by $101 billion in 2019 to just $36 billion in 2020 but were forecast to rebound to $82 billion by the end of 2021, and then $117 billion to June 2022.

These profit rebound forecasts have been keeping the share market rising over the past year. The magnitude and speed of the rebound appear ambitious at first sight, but we track it stock-by-stock and we have been confident that the rebound will be achieved or exceeded. The right chart shows the profit rebound targets by sector.
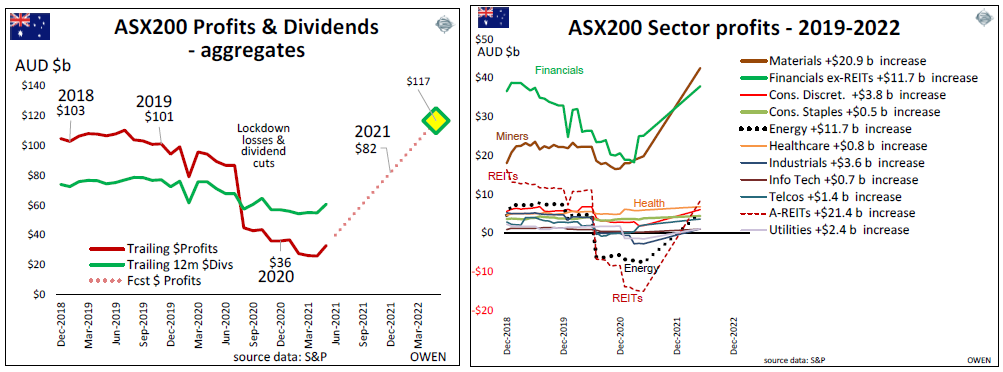
August is the main reporting season in Australia as most companies have June financial years. There are some significant exceptions, including three of the big four banks (ANZ, NAB and Westpac have September years), and most of the oil and gas majors have December years.

The US market (more than half of the global share market) has quarterly reporting whereas the ASX only requires half yearly, and the US and global markets are well ahead of target to more than fully recover their 2020 losses in 2021. 

The iron ore bonanza

The right chart above shows the Resources sector of the ASX was targeting a profit increase of $21 billion over last year. It looks ambitious, but it has already been achieved – from just the three big iron ore miners – BHP, RIO and FMG.

The table below sets out their combined increases in profits ($22 billion) and dividends (also $22 billion) from the June 2020 half to the June 2021 half.
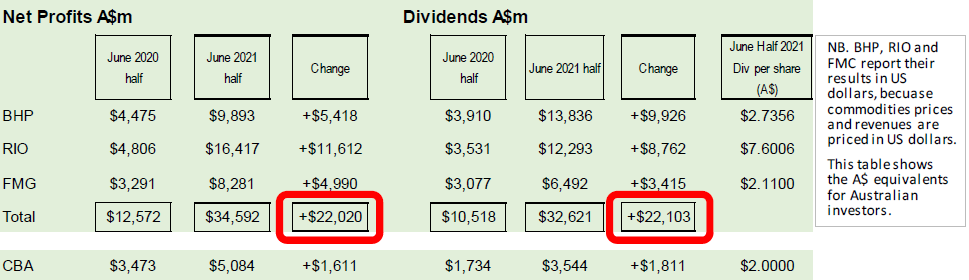
We also show CBA at the bottom of the table for comparison, as CBA is the largest stock in the ASX. CBA’s very respectable increases in profits ($1.6 billion) and dividends ($1.8 billion) over the same period have been dwarfed by the iron ore bonanza.


Ashley Owen is Chief Investment Officer at advisory firm Stanford Brown and The Lunar Group. He is also a Director of Third Link Investment Managers, a fund that supports Australian charities. This article is for general information purposes only and does not consider the circumstances of any individual.


  •   8 September 2021
  • 8
  •      
  •   
8 Comments
Alex
September 08, 2021

If only I had the fortitude to just buy an ASX200 equity fund and go and lie on the beach and forget it for 30 years.

Kevin
September 09, 2021

That is the very difficult bit,do nothing.I'm glad I find it very easy.
The WBC do nothing plan.Now I know that the price was $12.90 in 2001 ish.Compound the shareholding to double every 13 years using the DRP,wait for 40 years.Leverage up by borrowing enough to buy 1000,preferably 2000.
2000 shares grows to approx 16,000 shares by 2041.
Women that leave the workforce during child bearing years,their retirement pot still grows without the super contributions from work.
Hopefully at some stage ( say now),the debt is zero,and start the same thing again.20 years out from retirement,how much leverage do I feel comfortable with.Should I buy 1,2,or 3 further companies.
Diversification is taken care of through super.The fun and the learning process comes from what is outside of super.Once you put some skin in the game it is amazing how quickly you want to learn

This goes against everything we are told to do,I'd like to see what 16,000 shares in WBC are worth in 2041,and whatever else people choose to buy now.Highly unlikely I will be here in 2041.

Put your eggs in 1 or two baskets and watch those baskets carefully?
Or go with the conventional 'wisdom'

CC
September 11, 2021

you are forgetting that the index dropped by roughly 50% in 2008 and took about 11 years to return...

Graham Hand
September 11, 2021

Hi CC, Ashley's article is not about how long it takes to return to a previous high but the number of consecutive months of losses or gains.

Kevin
September 12, 2021

If that is aimed at me I have no idea what point you are trying to explain,or trying to see.I didn't buy the index,or spend anytime at all thinking, "but if you look over there".
From memory WBC bottomed at around $16,10 years later when banks hit top WBC was around $40.I didn't buy any at either of those prices.I would have picked up shares in the DRP during those periods.
To do nothing as I do then CBA was $5.40 in the first IPO.A rough calculation means using the DRP to today gives 1000 shares is now around 5000 shares.
$5400 grows to $500,000.At no time during that period have I ever thought I should rebalance,or sell them,or think of a few hypotheticals,or look over there

I am amazed at how many people will deny that the share price has increased from $5.40 to $100.
To return to WBC I put the date of the purchase up a week or two ago,$12.90 if I remember correctly.Whatever price they are in 2041 is what they will be.I would expect people to deny the facts in 2041 and say but if we look at this hypothetical,what does everybody else think,if we look over there .
I expect WBC to still be there in 2041.I expect people to retire in 2041,they have had the benefit of 40 years of superannuation.They have also had the benefit of WBC compounding for 40 years.I also expect them to deny this in 2041.

Chris
September 18, 2021

Kevin, hindsight is a wonderful thing though; the problem is, not every company that everyone thought "would be around forever" did well. AMP has always been a dog, Telstra was a lousy investment (anyone who bought it in the IPO is still underwater), Centro Properties (dubbed "the Macquarie Bank of Property Trusts"), Pasminco (one of the premier global zinc miners), Babcock and Brown (enough said) and back in 1991, "Orbital" Corp (with BHP as a 25% shareholder).

I'm sure that given the Future Fund, everyone would have expected Telstra to do well and always be there - just like the banks - but the real "X Factor" is how well they will do. Just being around doesn't necessarily make a good business.

Devi
September 10, 2021

Lying in the beach may not be a good option with rising sea levels. Neither is just having 2 baskets. I am very close to full retirement and to my astonishment my little SMSF seems to be floating on the sea of change quite nicely. COVid, ageing and a generation that lost their footing on a moving floor will need to be factored into results for the next 20 years. Maybe 4 baskets ? I won’t be around to check .

Stan
September 12, 2021

The smaller problem is that iron ore price collapsed from their peak of 220 $/T to 133 $/T which can already be seen in prices of the aformentioned companies.


Leave a Comment:

RELATED ARTICLES

Maintaining dividend income in turbulent times

It’s the large stocks driving fund misery

Winners and losers in sharemarkets, 2017/18

banner

Most viewed in recent weeks

Are you making these SMSF mistakes?

After four decades advising investors, there are a few common mistakes I've seen SMSF investors make. From holding too much cash and chasing yield to overtrading and trusting tips. Are these errors costing you?

Why have Australian living standards 'fallen' and how do we fix it?

For the last few years there has been much talk of a 'cost-of-living' crisis in Australia and of 'falling living standards'. Lately this has flared up again with the pickup in inflation resulting in a renewed fall in real wages.

Will you run out of money in retirement?

Fear of running out has become a defining retirement anxiety. Why do some retirees die with substantial wealth while others deplete their nest egg? Evidence suggests the answer is more complicated than we think. 

Four options for an income investor’s next dollar

What if Australia’s golden age of dividends is ending? Rather than overhaul your portfolio, it may be worth considering where new capital can work harder. I discuss four income strategies and the trade-offs behind each.

Retirement spending is not one-size-fits-all

New data challenges the idea that Australians are underspending their super. The bigger issue may be helping retirees navigate complexity, make confident decisions and use their savings to support security, wellbeing and choice.

The missing link in the CGT debate

A little-noticed consequence of Labor’s tax changes could have implications well beyond investors’ tax bills. The issue raises bigger questions about incentives, capital allocation and the drivers of long-term economic growth.

Latest Updates

SMSF strategies

Meg on SMSFs: What do we think about reversionary pensions these days?

Reversionary pensions have long been a staple of SMSF estate planning, but are they still the best option? Meg Heffron revisits a once-clear favourite and asks whether changing super rules have shifted the balance.

The ageing ‘crisis’ has not and will not happen

Rising age dependency is frequently treated as a warning sign for economies. But when actual workforce participation is examined, a strikingly different picture emerges about ageing, productivity and economic sustainability.

Retirement

How does the 4% rule stack up?

The 4% rule has long been retirement's gold standard. But after a difficult period for investors, fresh analysis suggests a more conservative approach may significantly improve the chances of making savings last.

Shares

Four charts that expose market concentration risk

Investors have recently been rewarded for backing market leaders, but history suggests this eventually comes at a cost. Now may be the time to review whether your portfolio is carrying unintended risks beneath the surface.

Investment strategies

The case for gearing beyond property

Most Australians gear into property but ignore shares. That may be a mistake. Used carefully, geared equity strategies can enhance long-term returns, reduce cash tied up in growth assets and support retirement income goals.

Economy

Australia's $1 trillion debt pile

The headlines exclaiming that Australian government debt has hit A$1 trillion and US government debt has hit $40 trillion has turned heads, but how serious are they really? Will Australia's mix of debt create challenges?

Economy

Has 100 years of growth made us any happier?

For decades, GDP has been the benchmark for economic success, but has it made us materially happier? If happiness does not rise in lockstep with prosperity, are we overlooking what constitutes a successful society?

Sponsors

Alliances

  • ASA-Logo-RGB-ActiveGreen-web.png

© 2026 Morningstar, Inc. All rights reserved.

Disclaimer
The data, research and opinions provided here are for information purposes; are not an offer to buy or sell a security; and are not warranted to be correct, complete or accurate. Morningstar, its affiliates, and third-party content providers are not responsible for any investment decisions, damages or losses resulting from, or related to, the data and analyses or their use. To the extent any content is general advice, it has been prepared for clients of Morningstar Australasia Pty Ltd (ABN: 95 090 665 544, AFSL: 240892), without reference to your financial objectives, situation or needs. For more information refer to our Financial Services Guide. You should consider the advice in light of these matters and if applicable, the relevant Product Disclosure Statement before making any decision to invest. Past performance does not necessarily indicate a financial product’s future performance. To obtain advice tailored to your situation, contact a professional financial adviser. Articles are current as at date of publication.
This website contains information and opinions provided by third parties. Inclusion of this information does not necessarily represent Morningstar’s positions, strategies or opinions and should not be considered an endorsement by Morningstar.