Whether finance or sport, people love talking statistics. Where cricketers talk batting averages and run rates, fund managers talk information ratios, hedge fund managers talk Sharpes and the academics talk t-statistics. What do all these statistics mean, can we reconcile them and are they useful?
The starting point for performance comparisons is often alpha, which for this article I define simply as performance relative to the market. Alpha can be positive or negative. Comparing the alpha of two fund managers may not be a fair comparison as they make take different levels of active risk and so they are not evenly matched.
Manager skill is better assessed using risk-adjusted return statistics, but different parts of the industry use different statistics to describe their performance. This is where our information ratios, Sharpe ratios and t-stats need some defining.
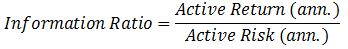
Information ratio
This ratio compares annualised realised alpha against the volatility of that alpha (known as tracking error or active risk). This statistic is most relevant for traditional fund managers who manage against an index. It addresses the question: what is the manager’s ratio for converting active risk into active return in a benchmarked fund?
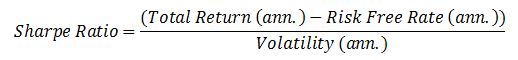
Sharpe ratio
This ratio, designed by Nobel laureate William Sharpe, focuses on the total excess return (return in excess of a risk-free return, typically cash returns) against the total volatility of returns. This statistic is most commonly used by hedge fund managers. Hedge fund managers are not benchmarked and have greater flexibility and so are assumed to ‘own’ all the risk that they take. It is considered appropriate to compare their total excess return versus the total volatility of fund returns.
t-statistics
t-statistics are statistical scores used for testing the significance of a result found in an empirical (data-based) analysis. t-statistics are similar to the better known z-scores associated with normal distributions. The t distribution is considered more appropriate than the normal distribution when it comes to sample data. If a result is significant, meaning that it is unlikely to have occurred by chance, then the t-statistic would be high.
Bringing statistics together
Unfortunately most statistics have shortcomings. I always recommend the use of multiple statistics and a qualitative overlay by an experienced professional is a superior approach when analysing funds. On one hand, the information ratio and the Sharpe ratio do not distinguish between skill and luck. The t-statistic indicates the chance of the return-for-risk observation occurring randomly but doesn’t focus on the scale of the outcome. Academics may find a statistically significant result but it may be one that generates only a small level of active returns which does not even offset fees – hardly a significant finding in a real world environment.
In a broad way, we can bring this all together. First note that the information ratio (IR) and Sharpe ratio (SR) are based on annualised data and we can think of them both as excess return-for-risk statistics. If they are used in their appropriate contexts then we can compare the two against each other. From here I will show how we can use the t-statistic to assess the probability of these results, allowing us to assess the potential of whether a result was simply random luck experienced by a manager with no skill.
The key relationship is that the t-statistic is equal to the return-for-risk statistic multiplied by the square root of time. We then use this statistic to determine the probability of this return-for-risk outcome over this time period. I do not detail this calculation to keep things simple; it is the findings which I think are more important.
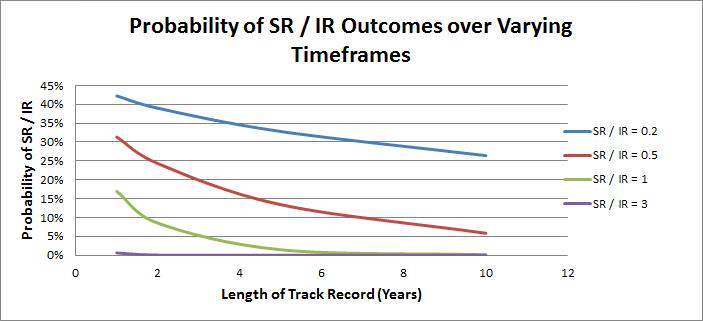
The chart below demonstrates the probability of different return-for-risk outcomes over varying time periods to be generated by a manager with no skill.
It is easier to understand the above chart using an example. Consider a fund manager with an information ratio of 1. If their track record is only one year in length then there is a 17% chance that this is just a random outcome generated by a manager with no skill. If the track record length is two years then the probability is around 9%, the five year probability number is less than 2%. If the track record is 10 years, the chance of generating a long term information ratio of 1 is very close to zero.
We can see the importance of the length of track record: for instance it is more likely that a manager with a 0.5 information ratio over five years has skill than a manager with a higher information ratio of 1 generated over one year.
We can also see how information ratios and Sharpe ratios of 3 are highly unlikely. In such cases you should dig deeper to understand why the return-for-risk ratio is so high.
Focus on length of track record
One important take-out is that comparing the information ratio or Sharpe ratio of fund managers with different track record lengths is a flawed approach unless you make a time adjustment. My rule of thumb has always been that a long term (greater than 10 years) information or Sharpe ratio of 0.5 is worthy of respect.
While interesting and useful this should be just one part of your analysis toolkit. I encourage caution when it comes to the use of performance statistics. For instance, these statistics assume that excess returns are (broadly) normally distributed, that they are not taking any binary bets in their portfolios (such as a hugely concentrated single stock or sector bet), and that the same teams, styles and processes have remained in place during the fund’s existence.
After all, batting averages generated in different eras against different bowling attacks on different pitches are not perfectly comparable.
During a 12 year amateur cricket career David Bell averaged substantially less than 10 with the bat. In mid-July 2014, David will become the Chief Investment Officer at AUSCOAL Super. He is also working towards a PhD at University of NSW.