Register For Our Mailing List

Register to receive our free weekly newsletter including editorials.

Home / 195

Watch premiums and discounts in LICs

Independent Investment Research (IIR) has released its December Quarter 2016 review of the LIC sector, sometimes called Listed Managed Investments (LMI). A summary of the performance of the 34 LICs included in the Report is presented below. The full paper with more detailed coverage is available here. As this full review is of the previous quarter, investors should check latest prices which may have moved significantly.

Overall equities performance

For the December 2016 quarter, the S&P/ASX200 was up by 5.2% following the US market rally after Trump’s election. Large cap equities, and especially resources stocks, contributed most to this performance. Small caps, down 2.5% for the quarter, still managed an overall gain for the year of 13.2%. For the 12 months to December 2016, the S&P/ASX200 was up 11.8%.

LIC performance

IIR’s analysis uses two different measures. The first is total returns (share price gain or loss plus dividends) which represents the actual return received by shareholders from their investment. The second is pre-tax NTA plus dividends, which is better for evaluating manager performance.

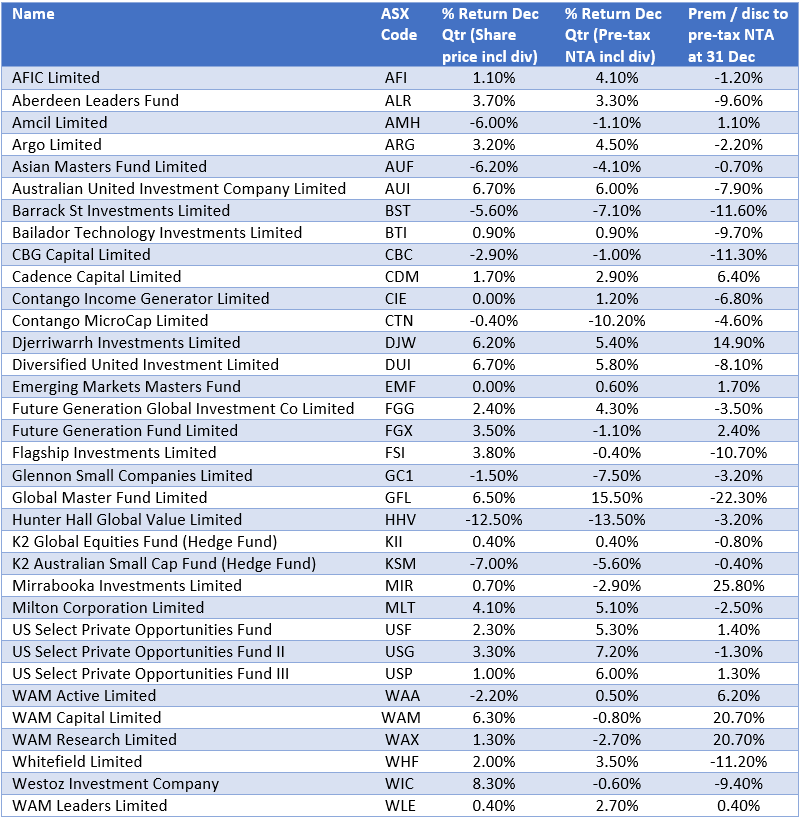
Using this second metric, the best performing fund for the December quarter was Global Master Fund (ASX:GFL) with a 15.5% increase in portfolio value due to a strong share price performance of its core holding, Berkshire Hathaway. As the overall market performed well, so too did the majority of LICs included in the Review. However, some small cap LICs had negative returns.

If using the first metric, Westoz (ASX:WIC) was the best performer for the quarter with an 8.1% total return in share price and dividends due to its resources focus. This reduced the discount to pre-tax NTA from 16.8% at 30 September 2016 to 9.4% at 31 December 2016.

Premiums and discounts

As at 31 December 2016, 12 of the 34 LICs covered were trading at a premium to pre-tax NTA. The largest of these was Mirrabooka Investments (ASX:MIR) at 25.8%, followed by WAM Capital (ASX:WAM) and WAM Research (ASX:WAX), each at 20.7%.

At the other end of the scale, Global Master Fund (ASX:GFL) was trading at the largest discount to pre-tax NTA at 22.3%, widening from 15.8% as at 30 September 2016. Over the past three years, GFL’s discount has averaged 14.4%.

The table below shows the quarterly performance for each of the 34 funds as measured by both metrics mentioned above, along with their premium/discount to pre-tax NTA:

Leisa Bell is Assistant Editor at Cuffelinks.

  •   23 March 2017
  • 5
  •      
  •   
5 Comments
Ashley
March 22, 2017

The table describes returns in terms of “share price including dividends”. Is that different from ‘total returns’ which is a widely understood term? (or even “total returns including dividends”). Share price does not ‘include’ dividends. It should say ‘share price gain/loss plus dividends’, which is the same as total returns.

Sceptical
March 23, 2017

Its kind of pointless to even reference the movement in the NTA as the investor into the LIC structure never receives that performance. The assumption that is made is the share price will move according to the movement in the NTA. But the real performance the investor receives is just the performance in the share price (what they bought it for and then what they sell it for/what it is currently trading at) + dividends. The structure itself is flawed and surely will be replaced with active ETFs if more providers come to market to offer choice!

Cat Daddy
March 23, 2017

Ashley.

What part did I miss. The article under sub heading LIC performance reads "(share price gain or loss plus dividends)"

Graham Hand
March 23, 2017

Hi CD, good pick up but we changed the previous wording after receiving Ashley's comment. We left his comment after the article as a way to explain one of the headings in the table, which we did not change.

Graeme
March 23, 2017

One should also be aware that LICs use a number of different ways are used to report their performance to their shareholders. While all LICs publish monthly a pre and post tax NTA, that's where commonality ceases.

At the conservative end of the spectrum, some managers report performance as change in post tax NTA adjusted for dividends paid. This is in my opinion the best measure of the change in value of the long term shareholder’s investment. Other managers will adjust this for tax paid and/or fees paid. Still others will use a portfolio return, again possibly adjusted for fees and taxes. I was surprised that the one year portfolio return (before taxes and fees in the fine print) of over 15% reported by one manager, equated to only a 2% increase in the after tax NTA adjusted for dividends paid.

Portfolio return is undoubtedly a useful method for comparison against a benchmark index, though one has to ensure the benchmark is appropriate. Why one dedicated microcap manager would benchmark against the All-ords index (primarily large banks, miners and retailers) beats me.


Leave a Comment:

RELATED ARTICLES

Listed Investment Company deals for 2019

Latest LIC and ETF updates

LIC reporting season wrap for 2017

banner

Most viewed in recent weeks

Building a lazy ETF portfolio in 2026

What are the best ways to build a simple portfolio from scratch? I’ve addressed this issue before but think it’s worth revisiting given markets and the world have since changed, throwing up new challenges and things to consider.

Ray Dalio on 2025’s real story, Trump, and what’s next

The renowned investor says 2025’s real story wasn’t AI or US stocks but the shift away from American assets and a collapse in the value of money. And he outlines how to best position portfolios for what’s ahead.

13 million spare bedrooms: Rethinking Australia’s housing shortfall

We don’t have a housing shortage; we have housing misallocation. This explores why so many bedrooms go unused, what’s been tried before, and five things to unlock housing capacity – no new building required.

21 reasons we’re nearing the end of a secular bull market

Nearly all the indicators an investor would look for suggest that this secular bull market is approaching its end. My models forecast that the US is set for 0% annual returns over the next decade.

Making sense of record high markets as the world catches fire

The post-World War Two economic system is unravelling, leading to huge shifts in currency, bond and commodity markets, yet stocks seem oblivious to the chaos. This looks to history as a guide for what’s next.

3 ways to fix Australia’s affordability crisis

Our cost-of-living pressures go beyond the RBA: surging house prices, excessive migration, and expanding government programs, including the NDIS, are fuelling inflation, demanding bold, structural solutions.

Latest Updates

Property

How cutting the CGT discount could help rebalance housing market

A more rational taxation system that supports home ownership but discourages asset speculation could provide greater financial support to first home buyers.

Investment strategies

The Ozempic moment for SaaS

Every investing cycle has its Ozempic moment, a narrative shock so compelling that the market briefly forgets that incumbents can and do adapt to transformative technology like AI.

Superannuation

Meg on SMSFs: Last word on Div 296 for a while

The best way to deal with the incoming Division 296 tax on superannuation is likely doing nothing. Earnings will be taxed regardless of where the money sits, so here are some important considerations.

Investment strategies

If people talk about a bubble, it’s unlikely to crash soon

It is almost impossible to identify a bubble in real time, and history shows they last far longer than we think, giving investors (perhaps misplaced) hope and short-sellers seemingly endless pain before the share price collapses.

Investment strategies

Seismic shifts that could drive private markets

Dealmaking appears to be on the mend, but investors could be well served to look through near-term trends toward six major themes that we think may drive private markets for years to come.

Latest from Morningstar

Corporations are winning the stock market. Here’s a new plan for everyone else

Retail investors have the worst trading record, according to a study of trading performance. Institutional investors weren't at the top either. Here are 6 ways to improve your odds.

Infrastructure

The bull case for Melbourne

A counterpoint to today’s prevailing narrative that Melbourne is the capital of a failing state defined by its strained public finances, COVID hangover and an opposition obsessed with undermining its own credibility.

Sponsors

Alliances

© 2026 Morningstar, Inc. All rights reserved.

Disclaimer
The data, research and opinions provided here are for information purposes; are not an offer to buy or sell a security; and are not warranted to be correct, complete or accurate. Morningstar, its affiliates, and third-party content providers are not responsible for any investment decisions, damages or losses resulting from, or related to, the data and analyses or their use. To the extent any content is general advice, it has been prepared for clients of Morningstar Australasia Pty Ltd (ABN: 95 090 665 544, AFSL: 240892), without reference to your financial objectives, situation or needs. For more information refer to our Financial Services Guide. You should consider the advice in light of these matters and if applicable, the relevant Product Disclosure Statement before making any decision to invest. Past performance does not necessarily indicate a financial product’s future performance. To obtain advice tailored to your situation, contact a professional financial adviser. Articles are current as at date of publication.
This website contains information and opinions provided by third parties. Inclusion of this information does not necessarily represent Morningstar’s positions, strategies or opinions and should not be considered an endorsement by Morningstar.