Register For Our Mailing List

Register to receive our free weekly newsletter including editorials.

Home / 283

4 reasons why investment performance comparisons are flawed

Over the course of 2018, the focus on peer relative comparison of superannuation fund investment returns has increased, fuelled by the usual end of financial year comparisons, and this year compounded by the Productivity Commission and Royal Commission reviews.

While it is right for fund returns to come under close scrutiny - after all, the impact of a lower return on a member's balance over the long term is significant - there are many aspects of these comparisons that are deeply flawed.

1. Excessive focus on the short term

Anyone who builds a multi-sector investment portfolio knows that they are designed to deliver over the long term. The focus should be on five years or more for most 'growth' or 'balanced' funds in the performance surveys, and even better seven or 10 years. The media and the survey providers grab on one year is largely meaningless.

2. Ignorance of investment objectives

The stated investment objective of most balanced superannuation funds is usually stated as a 'CPI plus' return over a specified time frame. For example, a 75% growth asset fund would typically have an objective of CPI + 3.5% over five years.

It was notable that during the Royal Commission hearings, the focus was almost exclusively on peer relative performance measures rather than performance against the investment objective. The Commission examined which funds had outperformed others, and more often than not industry funds versus retail funds. Yet even the bottom quartile fund in the SuperRatings survey has delivered 7.8% pa over five years and 5.7% pa over 10 years to June 2018 (the latter is lower as it still includes the impact of the GFC), against an investment objective of around 5.5% (based on CPI + 3.5%). The fact that almost all funds achieved their stated investment objective, even including the GFC, has been completely ignored. These funds have achieved what they had promised to deliver to members over the long term.

3. Major differences in asset allocation within same category

For reasons of practicality, comparison surveys include funds with a wide range of growth-defensive mixes in each bracket. For example, for the most-watched growth-oriented survey categories, SuperRatings covers 60-76% growth assets, while Chant West has a range of 61-80%. This is a very wide range. During rising equity markets, a fund with 60-70% growth assets will of course perform worse than funds in the 70-80% range.

A trend line of fund returns against growth asset levels suggests that a 10% increase in growth assets (from 65% to 75%) produced a 1% higher return over five years, and a 0.5% higher return over 10 years. This is enough to move a fund from 1st quartile to 3rd quartile over both time periods, a massive difference in performance ranking.

In this age of quantitative analysis, survey providers should provide a regression fit showing the best fit line for the results, which then allows a comparison of an individual fund's performance at the comparable growth asset allocation, as shown in the chart below. Funds could then be compared against what they should have been expected to return. A fund above the trend line has outperformed at its level of growth assets, and equivalently for those funds below the trend. This would then focus attention on funds relative to their own growth asset positioning.

After all, a fund with 76% growth assets could make bad decisions and underperform relative to what it should achieve, just as a fund with 65% growth assets can. The higher equity exposure should not disguise the real result.

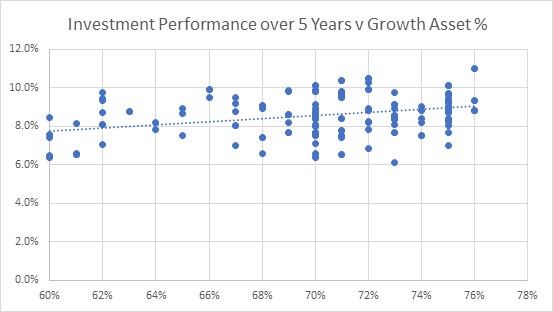
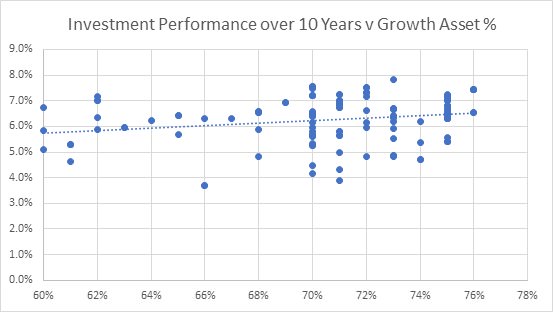
A resultant impact of the focus on peer relative performance is that funds have started to push themselves towards the top end of the survey brackets, so there is a cluster of funds with growth asset allocations towards the top end of the bracket (as can be seen in the above charts, for the SuperRatings survey).

Of course, targeting higher return also comes with higher risk. This is not necessarily driven by what is the best investment structure for their members, but by the desire to outperform competitors.

4. The growth versus defensive asset definition game

The assessment is made even more cloudy because there is no industry-wide standard for defining growth and defensive assets. While some assets are easily defined as 100% growth (listed equities, private equity) or 100% defensive (cash, sovereign and investment grade corporate bonds, inflation-linked bonds), there are many assets that exhibit both growth and defensive qualities, such as unlisted property and infrastructure assets, high yield bonds, alternatives.

Rather than having a standard accepted definition, funds are allowed to make their own choice. Inevitably, some funds have been aggressive in saying some growth assets are defensive, allowing them to load up on other growth assets to the point where they should not be in the survey bracket they are allocated.

Guidance for allocating between growth and defensive

Applying some simple metrics such as the ones below would provide guidance for how to allocate assets on the growth-defensive range, especially for unlisted assets:

  • Volatility (standard deviation) of the asset class (higher volatility = higher growth allocation)
  • Correlation of the asset class returns with listed equities (higher correlation = higher growth allocation)
  • The largest historical drawdown of the asset class over the last 30 years (bigger drawdown = higher growth allocation)
  • The breakdown of the asset class return into its capital and income components (greater % in capital return = higher growth allocation, and vice versa) and
  • The level of leverage of underlying investments within a fund (higher leverage = higher growth allocation).

Rightly or wrongly, survey providers have argued it is not their role to dictate to funds on this question. While that in itself is debateable – some leadership on this issue would actually be in their interests - what is needed is an industry-wide agreement (preferably sponsored by an industry body) on some parameters to decide the correct growth-defensive allocation.

As some unlisted property and infrastructure funds include a variety of types of assets, this could include requiring investment managers to provide an assessment of growth-defensive qualities of their own funds. For example, an unlisted property manager could assess each property on its capital and income components, historical volatility and the like, and conclude its fund on average should be classified as 50% growth and 50% defensive. A superannuation fund would then use these metrics to calculate a fund-wide breakdown of its product (as the sum product of the asset allocation and the growth % allocation).

While it may be too much expect the media to focus on long-term returns (both absolute and relative to peers) and performance against investment objectives, these relatively easy measures would markedly improve peer relative performance comparisons, and provide a more like-with-like comparison of fund returns. It would also remove the gaming currently prevalent in the system, and focus attention on the real story – generating a return net of fees and taxes that will meet the retirement needs of members.


Phil Graham is an independent investment committee member. Until recently he was Deputy Chief Investment Officer with Mercer.

6 Comments
Sean Henaghan
December 12, 2018

One obvious requirement for an asset to be classified as defensive is liquidity. As any member can withdraw their money with a day’s notice - how can liquidity be ignored??

Alexander Austin
December 07, 2018

Great article Phil

T Kennett
December 06, 2018

A very important topic for the purchasers of investment exposures - thanks Phil. Sadly fund sponsors and their advisors continue to let consumers down, as outlined in the article. Given the incentives and conflicts, agreement within the fund sponsor sector on meaningful definitions is unlikely. Consumers of investment products might therefore be best serviced with one relevant statistic for each product - the allocation to high quality defensive assets, defined as investment grade cash and sovereign debt securities. Investors at least will know how much of the portfolio can be considered capital secure, the dominant consideration for late stage accumulation and most pension stage investors. Not perfect but a vast improvement on the current virtually meaningless descriptors provided by funds like Hostplus cited in the article (and others) ?

Andrew Howse
December 06, 2018

I vote for a Fund Manager of the Decade. Prestigious and well earned...over a long period.

Richard Brannelly
December 06, 2018

Thanks for your well written article Phil. This is an issue many advisers have been ranting about for years now and concerted action by regulators needs to occur to prevent the gaming and blatant misrepresentation that is growing and becoming widespread. Ratings and research houses should also be a lot more diligent and call out some of the excessive abuses in this area for the benefit of those investors without the knowledge, time, or desire to undertake proper comparisons. The HostPlus "Balanced" fund is a classic example of this given they communicate a 25% allocation to defensive assets and sit in the upper range of the 61-80% growth category. A closer inspection of their self-labelled 25% weighting to "defensive" assets shows this is presently made up of 6% infrastructure 9% property 5% credit and 5% loosely labelled as alternative. A case could be made to say the funds actual allocation is 95% growth and 5% defensive and should rightly be called the HostPlus "High Growth" fund? Surely this warrants calling out and highlights the risks posed by "best of breed" comparisons and simple league ladder type analysis. HostPlus is not alone on this front and investors and superannuation members deserve better.

Jerome Lander
December 06, 2018

This is testament to the power of incentives, in this case the career need of those operating in this environment for their returns to be better than peers. This has the predictable result of pushing up allocations to equities to the highest possible level. Without a considered focus on investment risk in addition to return, the regulator and government may simply be exacerbating the already excessive reliance of these funds on simple equity risk. Effectively, these funds' businesses may then simply succeed or otherwise based on whether equities work or not - which is a binary bet in the current world. How well equities work largely determines the relative results of funds, and what is then considered a "superior" fund! Quite sad when clients may expect and assume they are in prudently managed and diversified portfolios....
How is this aligned with acting in clients' best interests and being outcome focussed? Sadly, it isn't! Caveat emptor!


Leave a Comment:

banner

Most viewed in recent weeks

2024/25 super thresholds – key changes and implications

The ATO has released all the superannuation rates and thresholds that will apply from 1 July 2024. Here's what’s changing and what’s not, and some key considerations and opportunities in the lead up to 30 June and beyond.

Five months on from cancer diagnosis

Life has radically shifted with my brain cancer, and I don’t know if it will ever be the same again. After decades of writing and a dozen years with Firstlinks, I still want to contribute, but exactly how and when I do that is unclear.

Is Australia ready for its population growth over the next decade?

Australia will have 3.7 million more people in a decade's time, though the growth won't be evenly distributed. Over 85s will see the fastest growth, while the number of younger people will barely rise. 

Welcome to Firstlinks Edition 552 with weekend update

Being rich is having a high-paying job and accumulating fancy houses and cars, while being wealthy is owning assets that provide passive income, as well as freedom and flexibility. Knowing the difference can reframe your life.

  • 21 March 2024

Why LICs may be close to bottoming

Investor disgust, consolidation, de-listings, price discounts, activist investors entering - it’s what typically happens at business cycle troughs, and it’s happening to LICs now. That may present a potential opportunity.

The public servants demanding $3m super tax exemption

The $3 million super tax will capture retired, and soon to retire, public servants and politicians who are members of defined benefit superannuation schemes. Lobbying efforts for exemptions to the tax are intensifying.

Latest Updates

Retirement

Uncomfortable truths: The real cost of living in retirement

How useful are the retirement savings and spending targets put out by various groups such as ASFA? Not very, and it's reducing the ability of ordinary retirees to fully understand their retirement income options.

Shares

On the virtue of owning wonderful businesses like CBA

The US market has pummelled Australia's over the past 16 years and for good reason: it has some incredible businesses. Australia does too, but if you want to enjoy US-type returns, you need to know where to look.

Investment strategies

Why bank hybrids are being priced at a premium

As long as the banks have no desire to pay up for term deposit funding - which looks likely for a while yet - investors will continue to pay a premium for the higher yielding, but riskier hybrid instrument.

Investment strategies

The Magnificent Seven's dominance poses ever-growing risks

The rise of the Magnificent Seven and their large weighting in US indices has led to debate about concentration risk in markets. Whatever your view, the crowding into these stocks poses several challenges for global investors.

Strategy

Wealth is more than a number

Money can bolster our joy in real ways. However, if we relentlessly chase wealth at the expense of other facets of well-being, history and science both teach us that it will lead to a hollowing out of life.

The copper bull market may have years to run

The copper market is barrelling towards a significant deficit and price surge over the next few decades that investors should not discount when looking at the potential for artificial intelligence and renewable energy.

Property

Global REITs are on sale

Global REITs have been out of favour for some time. While office remains a concern, the rest of the sector is in good shape and offers compelling value, with many REITs trading below underlying asset replacement costs.

Sponsors

Alliances

© 2024 Morningstar, Inc. All rights reserved.

Disclaimer
The data, research and opinions provided here are for information purposes; are not an offer to buy or sell a security; and are not warranted to be correct, complete or accurate. Morningstar, its affiliates, and third-party content providers are not responsible for any investment decisions, damages or losses resulting from, or related to, the data and analyses or their use. To the extent any content is general advice, it has been prepared for clients of Morningstar Australasia Pty Ltd (ABN: 95 090 665 544, AFSL: 240892), without reference to your financial objectives, situation or needs. For more information refer to our Financial Services Guide. You should consider the advice in light of these matters and if applicable, the relevant Product Disclosure Statement before making any decision to invest. Past performance does not necessarily indicate a financial product’s future performance. To obtain advice tailored to your situation, contact a professional financial adviser. Articles are current as at date of publication.
This website contains information and opinions provided by third parties. Inclusion of this information does not necessarily represent Morningstar’s positions, strategies or opinions and should not be considered an endorsement by Morningstar.