For the majority of Australian investors, the prospect of a new high for the ASX has been a long time coming, a slow grind rather than a heady and rapid climb. For those with exposure to the US, and particularly to the Magnificent Seven, however, share prices have rocketed. If you only look at your super fund returns a couple of times a year, or hold ETFs with broad market exposure, the picture is pretty rosy, but it’s always interesting to see which stocks are doing the heavy lifting, and how broad the performance of your portfolio really is. A few charts below put recent returns into perspective, and may give you cause for reflection.
The S&P500 has more than doubled since its Covid lows
Figure 1: S&P500 over five years
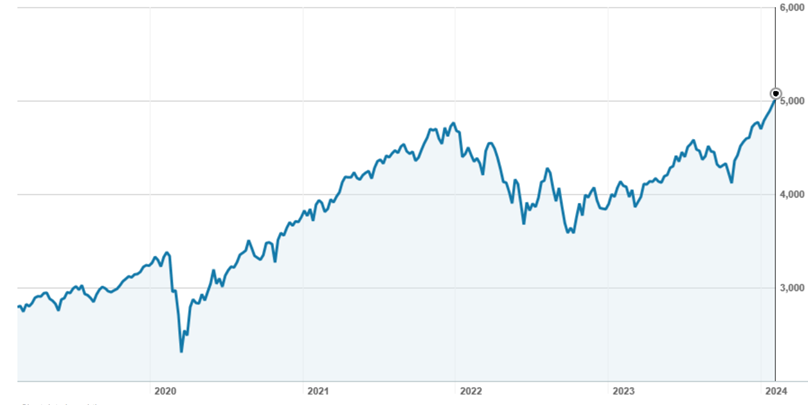
Source: nabtrade
While new highs make sense – one would hope that companies are growing their earnings and share prices appreciate over time – the S&P500 is now 15% higher than it was when the Fed started hiking rates in March 2022. This isn’t really what’s ‘supposed’ to happen. Even more incredibly, the index has closed higher 14 out of the last 15 weeks, the first time this has happened since 1972[1].
At the same time, the concentration of shares delivering strong performance has narrowed significantly. In 2023, more than 70% of stocks in the S&P500 underperformed the index – the highest proportion, by a substantial margin, this century[2].
The Nasdaq has also doubled but is only just retouching its highs
Figure 2: Nasdaq performance over five years
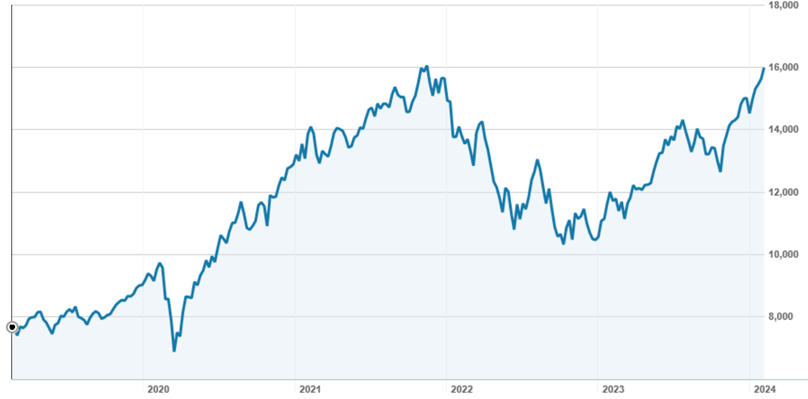
Source: nabtrade
Narrowing leadership
The primary reason for the incredible resilience of the S&P500 index – which is up 5% in the first six weeks of 2024 alone – is the Magnificent Seven group of stocks, which have been driving returns over the last 12 months. This group includes sector leaders Microsoft, Amazon, Alphabet (formerly Google), Meta (formerly Facebook), Tesla, Apple and Nvidia, all of which are found in the NDQ as well as the broader index. Since Microsoft invested in ChatGPT, the Mag7 have actually delivered more than 100% of the market return[3].
The performance – and size – of these companies is incredible. Nvidia, seen as a leader in the AI mania that hit the market in 2023, has gained over 50% in the last three months; given the recent falls in Chinese stocks, it is now more valuable than the entire market capitalisation of the Chinese stock market. In one week, the stock added the entire market capitalisation of Intel. Even so, with rapid earnings upgrades, its price to earnings (PE) ratio has actually fallen, although it is far from cheap. At a market cap of more than US$3 trillion, Microsoft is now worth double the entire S&P500 Energy sector but remains a strong buy or a buy among all but 4 of 55 analysts surveyed. The remaining four have the stock as a hold.[4]
Many have argued that the astonishing rise in the Mag7, which now comprise more than 28% of the S&P500, is a largely technical rally, driven by passive funds being forced to buy in as prices keep rising. Others have pointed out that the rally in mega tech was originally driven by the commencement of an earnings upgrade cycle in late 2022, and there has been divergent performance even within the leaders based on earnings outlook – after all, Tesla has fallen 22% in 2024.
So what’s going on in the rest of the market? As noted above, the S&P493 have been a significant drag on the market. According to Goldman Sachs, while the Mag7 are estimated to have added 14% year-on-year in sales for Q4, revenue growth for the remainder of the index was just 2%, while margins were contracting.
Small cap stocks in particular have failed to recover their post Covid highs. Early in US reporting season, nearly 400 small cap companies that had reported, had an aggregate Q4 earnings growth of more than -50%.[5]
The Russell 2000 has also doubled, but remains in bear market territory since 2022 highs
Figure 3: Russell 2000 performance over five years
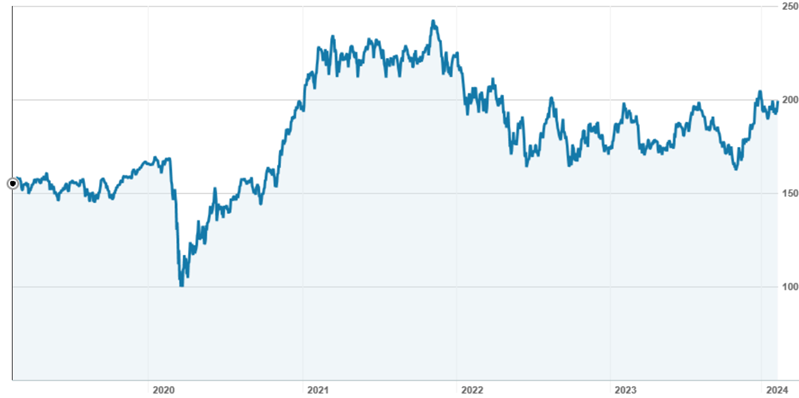
Source: nabtrade
A note of caution
So, six stocks have been doing terribly well, and the rest have been doing poorly, on average. While this is ‘just’ the US market, it is worth remembering the US comprises more than 70% of the MSCI World index, the index to which your global super portfolio is probably benchmarked[6]. At the end of January, Apple and Microsoft alone comprised more than 9% of that index[7].
As an investor, you don’t – necessarily – need to worry about this. Concentration in markets – and in sectors – is not uncommon, as successful businesses grow, and less successful businesses shrink or fail altogether. That said, this level of concentration is highly unusual. As noted above, less than 30% of the index is currently outperforming that index. The last time that happened was 1998-2000, after which the market fell 53%[8].
[1] Source: Standard and Poors
[2] Source: Macrobond, TheDailyShot
[3] Source: Refinitiv
[4] Source: Refinitiv
[5] Source: Refinitiv, GLJ Research
[6] Source: MSCI.com
[7] Source: MSCI.com
[8] Source: Fidelity International
Gemma Dale is Director of SMSF and Investor Behaviour at nabtrade, a sponsor of Firstlinks. Index charts as at 12 February 2024. This material has been prepared as general information only, without reference to your objectives, financial situation or needs.
For more articles and papers from nabtrade, please click here.
Full Disclaimer: The content is produced and distributed by WealthHub Securities Limited (WSL) (ABN 83 089 718 249)(AFSL No. 230704). WSL is a Market Participant under the ASIC Market Integrity Rules and a wholly owned subsidiary of National Australia Bank Limited (ABN 12 004 044 937)(AFSL No. 230686) (NAB). NAB doesn’t guarantee its subsidiaries’ obligations or performance, or the products or services its subsidiaries offer. This material is intended to provide general advice only. It has been prepared without having regard to or taking into account any particular investor’s objectives, financial situation and/or needs. All investors should therefore consider the appropriateness of the advice, in light of their own objectives, financial situation and/or needs, before acting on the advice. Past performance is not a reliable indicator of future performance. Any comments, suggestions or views presented do not reflect the views of WSL and/or NAB. Subject to any terms implied by law and which cannot be excluded, neither WSL nor NAB shall be liable for any errors, omissions, defects or misrepresentations in the information or general advice including any third party sourced data (including by reasons of negligence, negligent misstatement or otherwise) or for any loss or damage (whether direct or indirect) suffered by persons who use or rely on the general advice or information. If any law prohibits the exclusion of such liability, WSL and NAB limit its liability to the re-supply of the information, provided that such limitation is permitted by law and is fair and reasonable. For more information, please click here.