When the Strait of Hormuz effectively closed in late February 2026, it shut off approximately 15 million barrels per day of crude oil. The IEA described it immediately as the largest supply disruption in the history of the global oil market. On a gross basis, that assessment is correct.
Yet the oil price tells a more nuanced story. Despite the scale of the disruption, the price response has been more contained than the 1990 Kuwait invasion and far smaller than the 1973 Arab embargo. Understanding why reveals something important about how oil markets have changed.
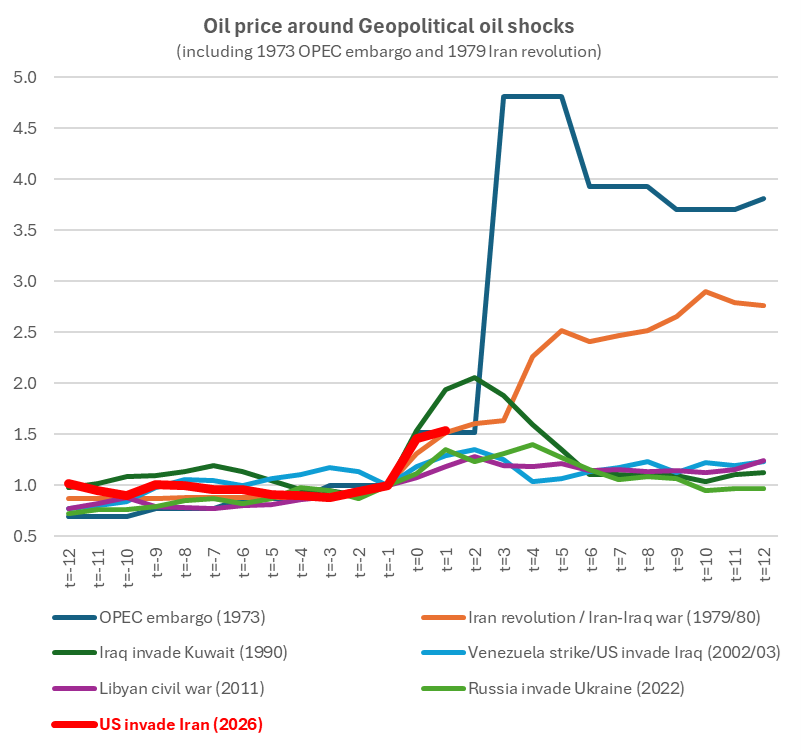
The chart below shows what happened to the oil price in the 12 months before and after each major geopolitical disruption over the past 50 years.
Source: Vertium, World Bank.
Note: Each line shows the oil price indexed to 1.0 at the trigger month. A reading of 2.0 means the price doubled; 0.5 means it halved. The x-axis shows months before and after, allowing each crisis to be compared on the same scale regardless of the absolute price level at the time.
The chart reveals two structurally different eras. Before the mid-1980s, the oil price was administered by OPEC, which is why the 1973 and 1979 lines did not mean-revert. OPEC's control began to unravel in the early 1980s as non-OPEC supply from the North Sea, Alaska, and the Soviet Union eroded the cartel's market share. By 1986, Saudi Arabia had abandoned its role as swing producer, switched to netback pricing, and flooded the market — collapsing prices from $34 to $9 a barrel and establishing the free market that has governed oil ever since.
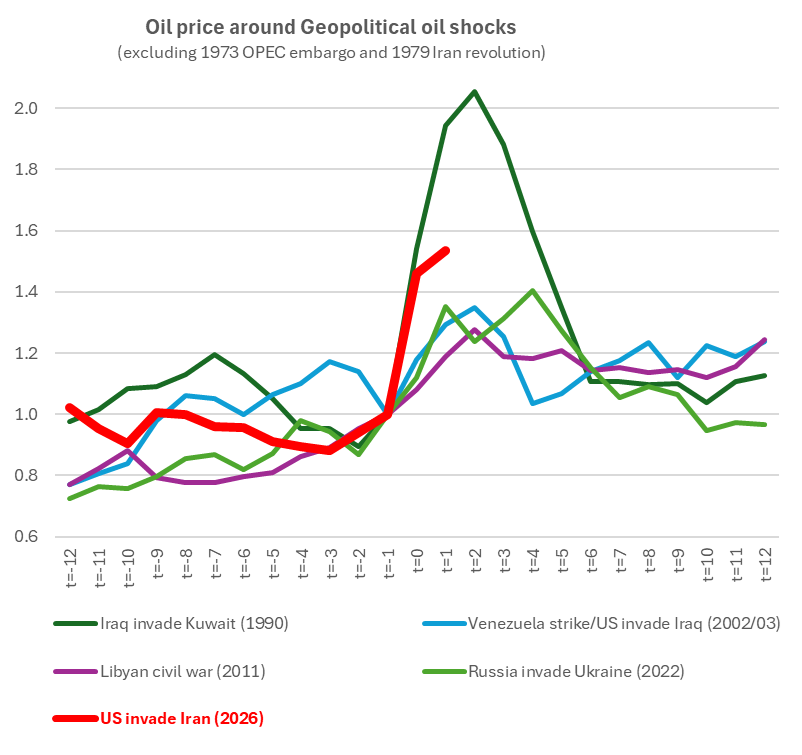
Once oil became freely traded, geopolitical shocks began exhibiting a consistent shape — a sharp surge at the point of disruption, a peak within four months, and a mean reversion as the market prices in resolution. The mechanism is the same each time: market participants price the supply disruption and the fear of what may happen next, adding a fear premium on top of the physical loss. But that premium is on borrowed time. Once the uncertainty resolves — through military outcome, diplomatic settlement, or simply the passage of time without further escalation — the fear component collapses and the price reverts toward the new physical reality. The following chart shows this pattern in isolation across the free market era.
Source: Vertium, World Bank.
The worst oil supply shock in history
On gross volume at risk, no prior event comes close to 2026. The Strait of Hormuz carries approximately 15 percent of global crude supply — more than three times the 1990 Kuwait invasion at 7 percent, nearly double the 1973 Arab embargo at 8 percent, five times the Russian invasion of Ukraine, and more than ten times the 2011 Libyan civil war. Yet despite being the largest supply disruption in history on a gross basis, Brent's move from $72 to $119 — roughly 65 percent — is smaller than both the 1973 quadrupling and the 1990 doubling. Three factors explain this apparent paradox.
1. Offsets have reduced the net disruption
In every major geopolitical supply disruption since 1986, the net market impact has been far smaller than the gross disruption suggested — almost always because Saudi Arabia stepped in. In 1990 it ramped production by approximately 3 million barrels per day to replace the lost Kuwaiti and Iraqi barrels. In 2002–03 it proactively raised output to 9.5 million barrels per day to absorb simultaneous disruptions in Venezuela and Iraq. In most post-1986 crises, Saudi Arabia's willingness and ability to act as swing producer has been the primary offset mechanism.
In 2026 that option is unavailable. Saudi Arabia's own oil is trapped behind the Strait — it cannot ramp exports through a closed chokepoint. What it has done instead is divert some of its crude down the East-West Petroline pipeline, bypassing the Strait and delivering to Yanbu on the Red Sea. That diversion, combined with other offsets such as the ADCOP pipeline and IEA strategic reserve releases, has partially contained the net disruption — but it is a far cry from the full swing producer role Saudi Arabia has played in every prior crisis.
The table below places all seven events side by side, showing how the offset mechanism has played out across every major disruption since 1973.

Source: Vertium, IEA, EIA
The 2026 net supply disruption is the largest since 1973. The offsets explain why the price has not surged even higher. However, they do not explain why, at this level of net disruption, the price response has been more muted than history might suggest. That is where factors 2 and 3 come in.
2. Current oil price is not fixed
The 1973 Arab embargo is a poor comparison for assessing the price impact of a supply shock. OPEC fixed the oil price at that time — the quadrupling was a cartel decision, not a market response to the physical disruption. OPEC used the physical disruption as leverage to permanently reprice oil at a level that reflected their desired revenue, not the size of the shortfall. The embargo lasted five months, from October 1973 to March 1974, and when it was removed it had no effect on the price level. In a free market, a five-month disruption followed by full supply restoration would produce a price that reverts toward its pre-crisis level. In 2026, it will.
3. The tail risk is contained
In 1990, prices more than doubled because the physical disruption was compounded by fear. Iraqi forces that had invaded Kuwait were advancing toward Saudi Arabia and threatened a further 5 to 6 million barrels per day on top of the 4.3 million already removed — a combined threat of nearly 10 million barrels per day, or roughly 15 percent of global supply. Saudi Arabia had the spare capacity to offset the disruption but refused to open the taps until American troops arrived in the Eastern Province. Once US forces were in place and the threat to Saudi infrastructure was definitively removed, the spot price collapsed to $20 a barrel within days.
In 2026, Saudi Arabia is a victim of the Strait of Hormuz closure rather than a swing producer sitting on the fence, and the disruption is already known and bounded. The one scenario that could change this is a closure of the Bab el-Mandeb. If the Houthis were to seal the Red Sea's southern entrance, the Petroline pipeline buffer would be negated. That tail risk is real but has not escalated.
Conclusion
Every geopolitical oil shock since the 1980s has followed the same pattern: the price spike is never permanent. The premium is driven initially by the physical disruption and amplified by fear of what might come next — and once the uncertainty resolves, it collapses.
The 2026 Hormuz closure is the largest supply disruption in history on a gross basis and the largest net disruption since 1973. Yet three factors have contained the oil price response. Offsets driven by pipeline diversion and strategic reserve releases have reduced the net gap. Unlike 1973, there is no cartel floor to hold the price elevated once supply returns. And unlike 1990, the tail risk of a further supply wave is currently contained.
The pattern may already be starting to play out. On 7 April 2026, President Trump announced a two-week ceasefire with Iran, subject to the complete reopening of the Strait of Hormuz. Brent fell more than 15 percent in a single session — the largest one-day drop since the 1991 Gulf War — pulling back from $119 toward $92. The market did not wait for the Strait to physically reopen. It priced the prospect of resolution immediately, exactly as the free market mechanism predicts. Whether the ceasefire holds and the Strait fully reopens remains to be seen — two weeks is a pause, not a settlement — but the direction of travel is clear. The fear premium is beginning to unwind.
For Australian energy producers, this matters directly. Woodside and Santos have benefited from the crude price surge, with earnings upgrades reflecting Brent's move from $72 to $119. If the mean reversion that has followed every prior free market oil shock plays out again, those upgrades will prove temporary. The picture is different for Ampol and Viva Energy. Even if crude reverts, refined product prices may remain elevated as long as Gulf refinery damage persists. The crude price may revert. The economic damage it leaves behind may not.
Jason Teh is the founder and Chief Investment Officer of Vertium Asset Management; and a Portfolio Manager at Clime Investment Management Limited, a sponsor of Firstlinks. The information contained in this article is of a general nature only. The author has not taken into account the goals, objectives, or personal circumstances of any person (and is current as at the date of publishing).
For more articles and papers from Clime, click here.