Nearly 60% of the Listed Investment Companies (LICs) in our coverage have delivered strong benchmark outperformance over the past decade, and LICs still look compelling as part of an investment portfolio.
Fees are part and parcel of any investment vehicle, including LICs, and can significantly affect real value, so they are always important. This article examines the costs associated with LICs and why some managers have higher fee structures than the average.
Types of fees
Fees and expenses generally take three forms:
- management fees
- administration fees
- performance fees.
Management fees seek to recover general day-to-day expenditure of the investment process. Traditionally, management fees range between 0%-2% of total cost, within the LICs in our coverage. Administration fees incorporate all other expenses incurred in the fund’s management such as director’s fees, rent, audit, and legal. These fees are charged regardless of performance and may vary considerably depending on the fund manager’s investment mandate, style and approach.
Performance fees seek to directly align the profitability of the manager and the performance of the underlying fund. A performance fee is best described as a reward for performing above the fund’s stated benchmark. Typically, performance fees range between 10%-20% of the value above the benchmark, and as an investor you need to consider the performance fee’s structure and whether you think it’s fair and aligns the interests between the portfolio manager and investor.
While lower fees do not guarantee superior performance, they are less of an impediment on returns. In fact, many of the higher fee mandates operate in less-efficient sections of the market and often outperform the market, i.e. smaller caps mandate LICs.
Indirect Cost Ratio = Indirect Cost/Average Pre-Tax NTA
The Indirect Cost Ratio (ICR) is the aggregation of indirect costs divided by the average pre-tax net tangible asset for the year and presented as a percentage. Indirect costs generally include management fees, performance fees, legal, accounting, auditing and other operational and compliance costs. Throughout our coverage, we produce both the ICRs with and without performance fees.
Comparing fee structures
Our analysis of the LICs in our coverage alludes to some interesting facts.
First, certain strategies are more cost-intensive to execute than others. This could be due to the heavy resourcing required to effectively implement a mandate (international assets), a lack of research coverage in an underlying market (small caps) or sophisticated investment strategies (long/short infrastructure assets).
Second, the specialised nature of these strategies in less efficient parts of the market may give the managers the consistent ability to outperform the market or deliver an effective risk-weighted return. However, you need to clearly evaluate this in the context of the offering.
Click to enlarge
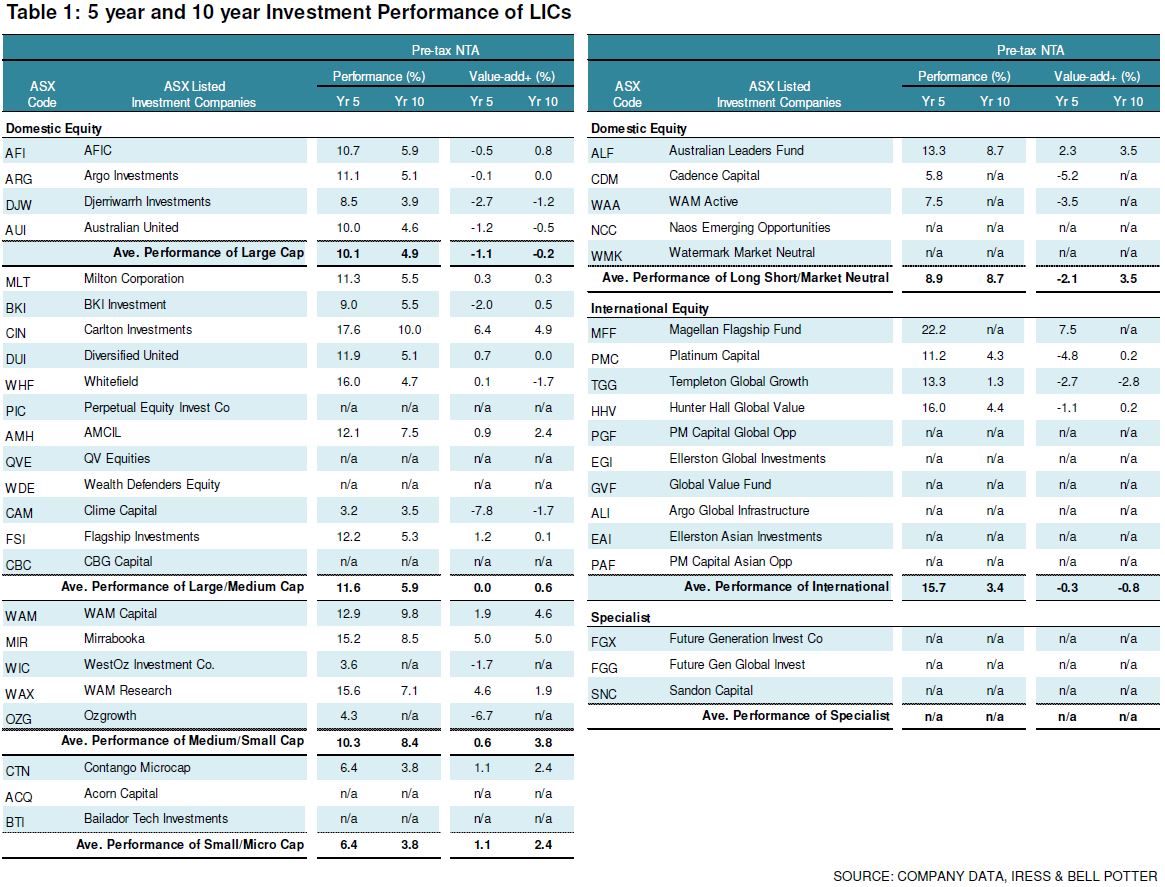
Putting this into perspective, the average performance (pre-tax NTA) of large-cap focussed LICs in our universe is 10.1% over five years and 4.9% over 10 years, large to medium cap LICs is 11.6% and 5.9% respectively, while medium to small is 10.3% and 8.4%. Small to Micro LICs is 6.4% and 3.8%, Long Short/Market Neutral is 8.9% and 8.7%, International is 15.7% and 3.4%. However, there is not sufficient data for specialist LICs over those periods.
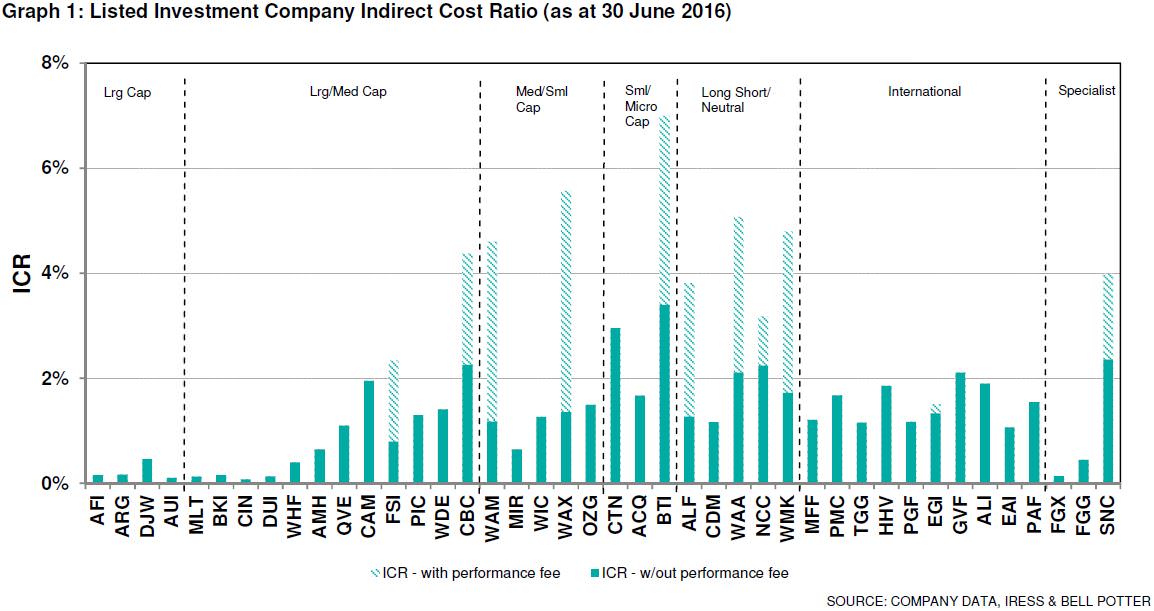
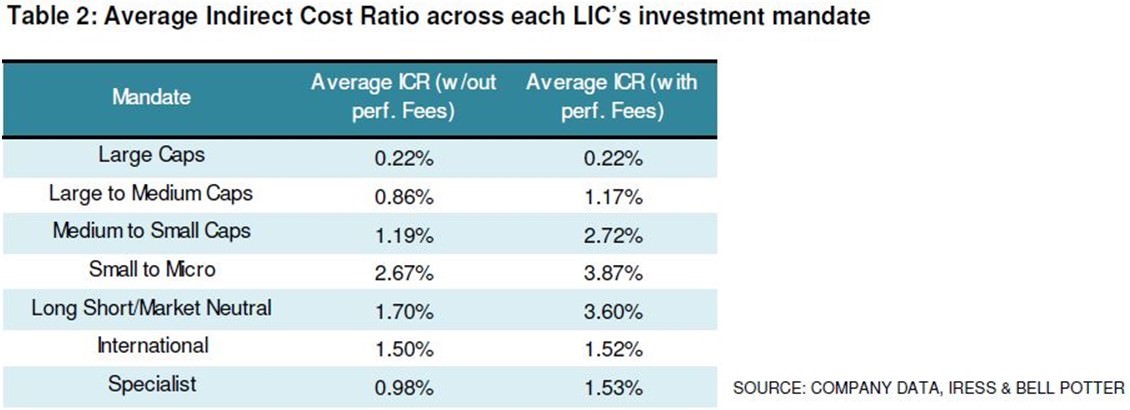
Overlaying this with average Indirect Cost Ratio, you will note the different fee structures across each mandate:
Click to enlarge
Broadly speaking, there are seven LICs with an ICR of below 0.20% These are a viable option if cost is a major factor in deciding to invest in a LIC. This ICR is materially lower than most industry funds, retail funds, index funds and exchange traded funds (ETFs) listed on the ASX.
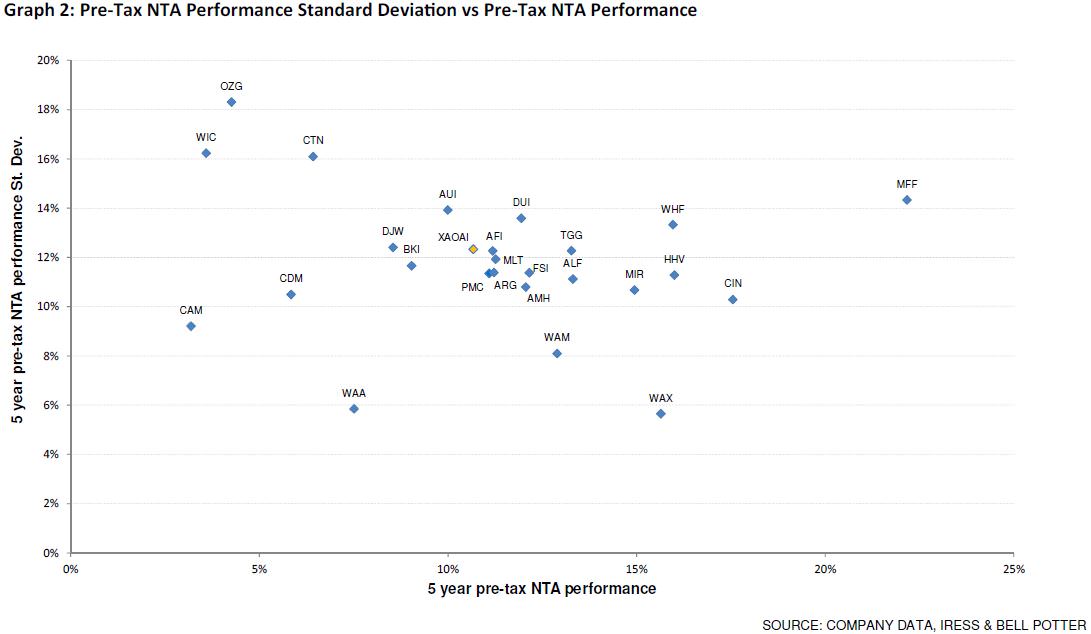
However, if investors focus purely on cost, they would neglect some of the better performing LICs, particularly on a risk-adjusted basis. The graph below reflects the risk return of each LIC over the past five years. The vertical axis highlights the standard deviation of the investment performance, while the horizontal axis displays the LIC’s pre-tax NTA performance (investment performance).
Click to enlarge
On a five-year risk adjusted perspective, the best performing domestic LICs are WAM Capital (ASX:WAM) and WAM Research (ASX:WAX). These funds outperform all other vehicles by a material margin while offering a lower risk profile. The Magellan Flagship Fund (ASX:MFF) was the best-performing international LIC. We attribute these strong performances to a more cost-intensive mandate and performance fee structure that some of these LICs apply.
Conclusion
Fees clearly weigh on performances, and an excessive fee structure will make it increasingly difficult for a manager to outperform their benchmark. However, investors also need to consider whether the fee structure is appropriate. It is the manager’s ability to consistently deliver an effective, risk-adjusted return after fees and taxes, that counts in the long run.
Nathan Umapathy is Research Analyst at Bell Potter Securities. This article has been prepared without consideration of any specific person's investment objectives, financial situation or needs and there is no responsibility to inform of any matter that subsequently may affect any of the information. For the latest Bell Potter Quarterly Report and NTA updates, click here.