For investors in managed investments, it is important to focus on the total returns achieved. We use two measures of performance for listed managed investments (or listed investment companies, LICs). They are the ‘share price return’, which reflects movements in the share or unit price of the LIC, plus dividends, and the ‘NTA return’ which measures movements in the NTA after tax but before tax on unrealised gains. We generally refer to this as ‘pre-tax NTA plus dividends’. We prefer this measure as we believe it gives a better indication of the underlying portfolio performance after allowing for cash taxes paid, expenses, and manager fees. These returns can be directly influenced by the manager, whereas managers have limited control over the share price movement.
However, we do recognise that many investors in LICs are looking for attractive, stable and steadily growing, dividends or distributions. In this case, it is important to focus on the profits generated by LICs, as dividends can only be paid out of profits and profit reserves. In this report, we look at how the LIC sector fared in the latest reporting season. We also review the LICs under our coverage that offer the highest dividend yields and assess the sustainability of those dividends.
During the recent reporting season, 21 of the 29 LICs we cover that reported results for the six months to 31 December 2017 increased their profits over the prior comparable period. This reflected growth in income from their underlying portfolios, including higher dividend income and capital appreciation.
LIC dividends remain attractive
The solid profit reporting season was positive for dividends, with no LICs reducing dividends. Of those paying dividends for the half, 16 increased dividends, albeit some were very modest increases, and 10 held dividends steady. Four of the five largest LICs increased dividends with AFI the only one to hold its dividend steady. The sector continues to offer attractive yields with the five largest LICs offering an average yield of 4%, broadly in line with the S&P/ASX All Ordinaries yield of 4.1%. Dividends from the top five are fully franked, whereas the average franking of the All Ordinaries is lower.
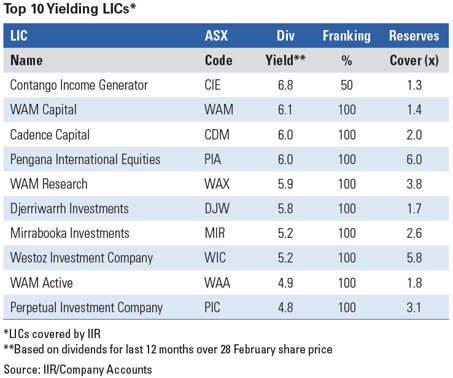
In the table above, we have shown the 10 highest yielding LICs in our coverage universe. We have based our calculations on the last 12 months dividends payments. We have included special dividends only if we believe they are paid regularly. In order to be able to pay dividends, LICs need to generate profits. However, it is possible for LICs to pay out more than they generate in profits in a given year by dipping into retained profit or dividend reserves from prior years. LICs can smooth dividend payments to their shareholders by retaining profits rather than simply paying out 100% of earnings each year.
The table above shows our estimates (based on published accounts at 31 December 2017) of the number of years each LIC could retain its current dividend payments without generating any additional profits. We think this is a good indicator of dividend sustainability when markets turn down. Coverage of one means that a LIC could maintain its current dividend payout for one year without generating any profit in the current year. The five largest LICs (not shown in the table above) all have coverage of at least two years, except BKI which has coverage of one year. This means they are well-placed to maintain dividends at current levels unless the markets experience a sharp and prolonged downturn.
Pengana has the highest dividend cover
Pengana International Equities (ASX:PIA) maintains the highest dividend reserves coverage level at six years, which should continue to support its high payout levels. However, we note that given it invests in global shares, maintenance of franking at 100% will depend on its ability to continue to generate sufficient realised profits (on which it pays Australian tax) from its portfolio.
Resources recovery boosts Westoz profit reserves
Westoz Investment Company (ASX:WIC) has significantly increased its dividend coverage over the past six months given strong returns from its portfolio which has benefited from exposure to the rebound in resources. Coverage has increased from 3.3 years to 5.8 years meaning it is well placed to maintain its current dividend of six cents per share. However investors should remain mindful of the fact that, with the portfolio exposed to the West Australian resources driven economy, returns and earnings can be volatile. The board is targeting a dividend of six cents per share for FY2018.
WAM Research maintains strong cover and WAM Active increases cover
WAM Research (ASX:WAX) continues to maintain strong dividend reserve cover at 3.8 years and Perpetual Investment Company (ASX:PIC) has built up strong coverage in its short period since listing. Cadence Capital (ASX:CDM) has managed to increase its reserve cover from one to two years over the past six months.
We note that WAM Active (ASX:WAA), which was forced to significantly cut its dividends in 2015 after becoming too aggressive with it payouts, has rebuilt its dividend cover to a slightly more comfortable level of 1.8 years. This should be able to support its current approach of steadily and progressively increasing its dividend in the absence of weaker market conditions.
Highest yielding LICs have lowest reserve cover
It is worth noting that the two highest yielding LICs, Contango Income Generator (ASX:CIE) and WAM Capital (ASX:WAM) also have the lowest coverage. Provided markets continue to perform reasonably well, we do not see an immediate threat to the dividends from these LICs. However, in a material and sustained downturn, when it is more difficult to generate portfolio gains, dividends would most likely come under pressure.
Continue to focus on total return
We encourage investors to focus on LIC total portfolio returns, not just dividends, and before investing in individual LICs, ensure they meet their individual portfolio needs.
Peter Rae is Supervisory Analyst at Independent Investment Research. This article is general information and does not consider the circumstances of any individual.