While the long-term returns from 'value investing' are strong and well documented, the technique has struggled over the past decade prompting many investors to question its merits.
This article discusses value investing from an Australian perspective. The traditional classifications of ‘value’ include earnings, book value and dividends, but value investing by ‘free cash flow’ (FCF) has performed well through market cycles. FCF value investing has also displayed lower levels of volatility when compared to traditional classifications.
These conclusions support our investment philosophy, which is built around the notion that companies undervalued by FCF and franking will outperform over time.
A long-term perspective
The chart below highlights the performance of value investing in an Australian context using more than four decades of data provided by Professor Kenneth French.
Returns of ‘value’ portfolios relative to ‘glamour’ portfolios (December 1974 to December 2016)
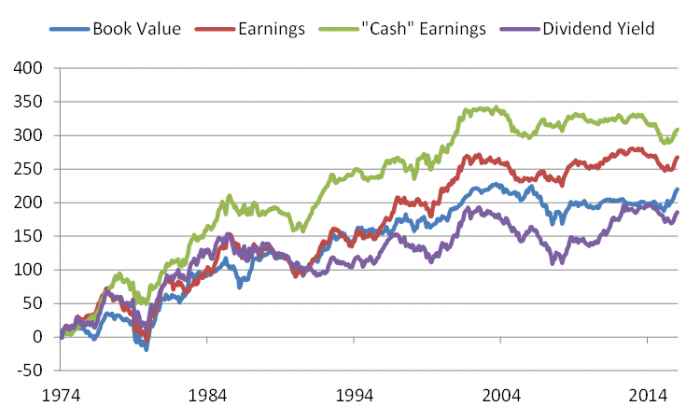
Source: Professor Kenneth French. Portfolios are formed using four valuation ratios: book-to-market (B/M); earnings-price (E/P); cash earnings to price (CE/P); and dividend yield (D/P). The raw data is from Morgan Stanley Capital International for 1975 to 2006 and from Bloomberg for 2007 to 2016.
The ‘value’ portfolios contain firms in the top third of a ratio and the 'glamour’ portfolios contain firms in the bottom third. Portfolios are formed at the end of December each year by sorting on the four ratios and then computing value-weighted returns for the following 12 months.
Over the 42-year period for which data is available, value portfolios outperformed glamour portfolios by between 5% and 9% per annum depending on the way ‘value’ is defined.
15 years of poor performance
The data presented below shows returns to value investors in more recent periods have been less than stellar, prompting some commentators to question its merits.
Average annual returns of ‘value’ portfolios relative to ‘glamour’ portfolios (December 1974 to December 2016)
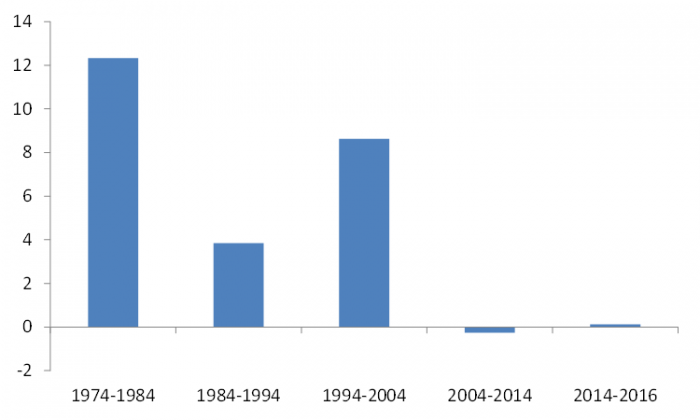
Source: Professor Kenneth French. The raw data for Australia is from Morgan Stanley Capital International from 1975 to 2006 and from Bloomberg from 2007 to 2013. US data is from CRSP. The chart represents the average of four portfolios.
Traditional ‘value’ has become a crowded trade
Anecdotally, there has been more institutional asset allocation towards value strategies in recent years, focusing on the traditional classifications listed above. In addition, many commonly deployed ‘risk models’ use the mainstream classifications to measure the extent of a portfolio’s value exposure.
The focus of institutional asset allocation towards simple strategies concentrating on the four classifications may have reduced the excess returns available from pursuing such strategies. The growth of ‘smart beta’ strategies, which are usually focused around simple and observable value classifications, accentuates this situation.
Traditional classifications of value are more often based on accounting earnings and management’s manipulation of dividends. The recent ramp up in dividend payout ratios and the growing divergence between statutory and ‘underlying’ earnings are examples of this. Of course, this unsustainable situation can lead investors to mistakenly classifying stocks as ‘cheap’ at particular points in time leading to poor investment outcomes.
This situation will be helped by classifying stocks based on their capacity to generate cash flow above that needed to sustain and grow their businesses (‘FCF’). The use of FCF rather than accounting earnings or dividends is important because management can less readily manipulate the measure.
Returns of ‘value’ portfolios relative to ‘glamour’ portfolios (March 2004 to June 2017)
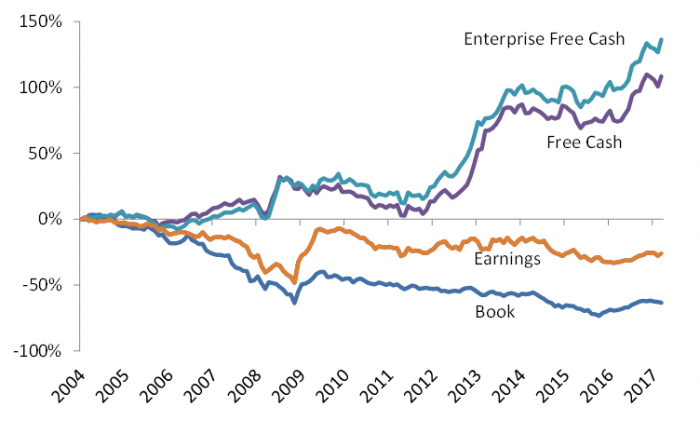
Source: Merlon Capital Partners. Portfolios are formed using four valuation ratios: FCF-to-price (F/P); enterprise-FCF-to-enterprise-value (EF/EV); earnings-to-price (E/P) and book value-to-market (B/M). Monthly portfolio returns are calculated by equally-weighting all sample companies and sorting from top to bottom by each valuation ratio. The ‘value’ portfolios contain firms in the top one third of a ratio and the ‘glamour’ portfolios contain firms in the bottom third. The analysis is based on S&P/ASX200 constituents, and the raw data is from Bloomberg.
The performance of a value strategy that classifies stocks based on FCF has performed well with lower risk compared with traditional accounting-based alternatives. This finding supports our investment philosophy built around the notion that companies undervalued by FCF and franking will outperform over time.
Why do cash flow-based value strategies outperform?
We do not believe that value stocks outperform simply because they are ‘cheap’ but rather because there are misperceptions in the market about their risk profiles and their growth outlooks. A good investment requires market concerns to be priced in or deemed invalid. We incorporate these aspects with a ‘conviction score’ that feeds into our portfolio construction framework.
In a second paper to be released next quarter, we will explore why value strategies based on FCF outperform the broader market. We will present findings that dismiss the notion that value investing is 'riskier' than passive alternatives and support the presence of persistent behavioural biases in investor expectations.
Hamish Carlisle is an Analyst and Portfolio Manager at Merlon Capital Partners, an Australian-based boutique fund manager specialising in equity income strategies. This article is general information and does not consider the circumstances of any investor.