Vivek Prabhu is Head of Fixed Income at Perpetual Investments and Portfolio Manager of Perpetual’s Diversified Income Fund and Ethical SRI Credit Fund. This interview took place in mid-February 2020 before the full implications of coronavirus were known.
GH. Fixed interest and high-yield trusts have attracted billions of dollars of retail money in the last two years. What are the dangers an investor should watch in that sector?
VP: Obviously, the interest in high-yield trusts is driven by cash and term deposit rates paying less than 1%. The key risk factor in these products is whether they're concentrated in one sector. In credit markets, you're paid a premium to cover for default risk. It’s a highly asymmetric risk profile. You receive regular and frequent small returns from interest coupons, but if the issuer defaults, you're exposed to potentially losing all your capital. It makes diversification really important, not only by company but also sector.
GH: What’s a sector where some listed trusts are not diversified enough?
VP: For example, property construction and property development. Some trusts are offering over 5% but concentrated in a risky sector.
GH: Indeed, any retail investor who owned bonds issued by Axcesstoday which defaulted recently now knows that even if they held another nine bonds from other companies, that’s not enough for portfolio diversification.
VP: Yes, there are not many free lunches in investing, but diversification is definitely one.
GH: Most asset classes have done well in the last few years. Would you identify anywhere in the credit markets that you think is either cheap or expensive at the moment?
VP: There are some good opportunities in RMBS (residential mortgage-backed securities). In the chart below, using the left-hand axis, the red dotted line shows the ratio of credit spreads on RMBS relative to senior major bank issues. RMBS gives a good pickup. Senior unsecured major bank paper is rated AA-, and there are only a handful of banks around the world which carry a AA rating, and Australia has four of them.
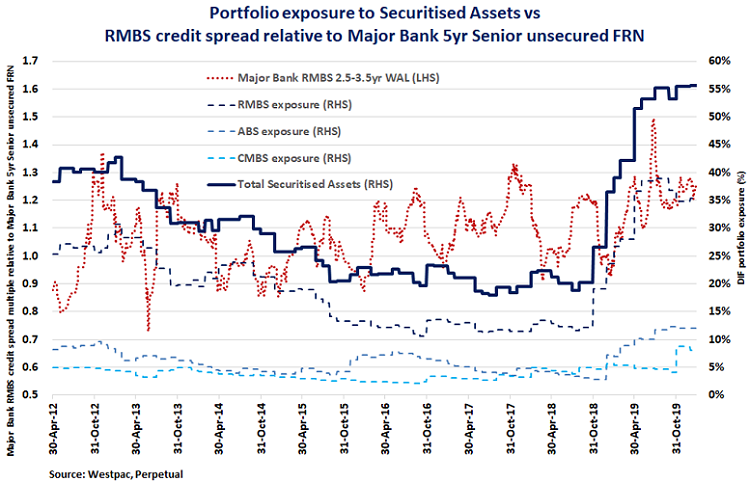
GH: Make sure I understand this chart. A multiple of 1.0 means senior unsecured bank paper trades at the same margin as a major bank RMBS, right?
VP: Yes. At the moment, prime RMBS earns a credit premium of around 100bp (1%) compared to senior major bank credit premiums in the low 70 basis point area (0.7%), but unlike the bank paper, RMBS is secured by the underlying mortgages as collateral. And so the RMBS gets a AAA rating. The benefit of the RMBS structures is that as homeowners repay the principal and interest on their mortgages, the bondholder receives some of the principal back.
It’s very different to a corporate or bank bond, where the principal is repaid on maturity. It greatly reduces refinance risk because something is repaid monthly or quarterly. So not only is it higher rated and secured against collateral, you're also getting your principal back and a higher return.
GH: Yes, I personally own some RMBS and the regular cash flow is much greater than from a bond. You just have to record that the principal is no longer 100 on maturity.
VP: Yes, and the underlying risks in RMBS are similar to banks since residential mortgages make up over 60% of bank assets, plus with RMBS the underlying assets are in a more robust structure.
In the chart above, the dark blue line measured on the right-hand axis shows the percentage of my portfolio in all securitised assets and it’s over half, currently 55%, which is a record high in the 15-year history of the fund. It’s been as low as 20% when the relative credit spread was not as attractive. Since the end of 2018, I've been derisking my portfolio into quality securitised assets. The move up to 55% has been in lockstep with improving valuations as well.
GH: Are you buying the RMBS AAA class or also lower down the credit spectrum?
VP: Predominantly I’m in AAA but I am permitted to buy across the capital structure in RMBS and bank paper. Where I have reduced my exposure to fund the buying of AAA is by selling the BBB-rated securities. Look at this graph below which shows BBB credit spreads versus single A spreads. At the end of 2011, I had a low exposure to BBB (the red line below based on the right-hand axis), only about 10% of my portfolio. At that time, a BBB spread was equal to a single A spread (the multiple in the blue line measured on the left-hand axis).
GH: Again, a multiple of 1.0 means the BBB and A traded at the same margin, the blue line?
VP: Yes. At a multiple of 1.0, you're getting paid the same credit spread on A rated securities as you were on more risky BBB rated securities. The multiple has averaged 1.6 times over the last decade, and you can see it’s been as high as 2.5 times.
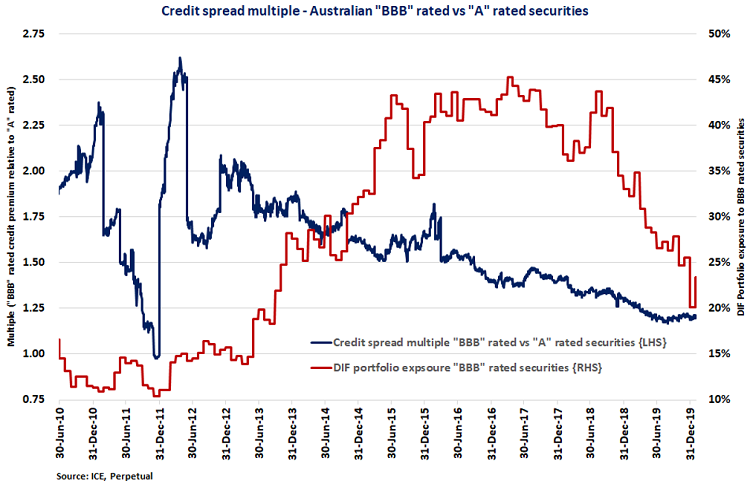
Then in early 2012, BBB credit spreads blew out and so I started to add BBB exposure. Now, since that period, my exposure has gradually drifted down. My BBB exposure peaked around mid-2015 when BBB spreads were close to their long-term average and I held this overweight position until late 2018. Not only was the multiple attractive, but it was falling consistently, which benefitted portfolio performance.
But as I mentioned, towards the end of 2018, in August, September, I began to derisk in the portfolio. Part of the thinking was that central banks were aiming to withdraw liquidity from the financial system for the first time since the GFC.
GH: That’s the late 2018 fall in the equity markets as well.
VP: Correct, a big risk-off time across all markets. My derisking moved into AAA senior secured amortising RMBS. But as we all know, in 2019, central banks did a big pivot, not withdrawing liquidity. And so the underlying catalyst for derisking changed, but notwithstanding I maintained the exposure to senior AAA asset backed and RMBS securities because the valuations were attractive.
GH: How much money is in the Perpetual Diversified Income Fund?
VP: Across the strategy, we have about $2.2 billion, and this Fund holds about $1.25 billion.
Going back to your first question on the fixed income risks, a lot of people who've chosen to maintain return (rather than accept lower returns for a given level of risk) have been chasing high yield or unrated bonds, but also pushing down margins at the bottom of investment grade (BBB). So I’ve been reallocating to the top of the credit spectrum.
GH: Last year, the Diversified Income Fund earned about 4% and the most recent running yield is 2.48%. Have the gains already been made in this sector?
VP: Well, if we look at the returns of that Fund over the long term, it has generated about two-thirds of its alpha from the running yield, or the credit premium, currently about 170bp above the bank bill rate. Plus we generate about one-third, or another 90bp, from active management strategies. So all other things being equal we could generate a gross return of 3.5%.
GH: Perpetual also has a listed credit fund, the Perpetual Credit Income Trust (ASX:PCI). What's the relationship between that and this?
VP: Not a direct relationship in that PCI has a less-constrained credit strategy, whereas the Diversified Income Fund is predominantly investment grade with a target return of BBR plus 200bp (2%). The Diversified Income Fund requires a minimum 75% of the portfolio in investment grade securities of BBB or above. It’s currently 91.7%. The PCI requires a minimum 30% in investment grade.
GH: How much change in credit spreads can the Diversified Income Fund tolerate before it starts to make losses?
VP: The portfolio has a maximum weighted average maturity limit the five years. Currently, the weighted average maturity is 2.8 years. And with a credit spread of 170 basis points (1.7%) above BBR, if you divide 170 by 2.8 years that's your 12-month break-even point on credit spreads. So we can afford spreads to widen by 60bp (0.6%) before we erode the credit yield premium. Looking at the total portfolio yield of 2.48%, credit spreads could widen by 90bp before you erode portfolio returns. And because it’s floating rate, from an interest rate point of view, there is no meaningful exposure to capital volatility as interest rates go up and down because it simply affects the income generated from the portfolio, not the capital value.
GH: In SMSFs, there is still a large allocation to term deposits. Why have term deposit rates fallen so much recently, further even than cash rates?
VP: Here’s a chart of cash rates, term deposit rates and the return on the Diversified Income Fund (light blue and dark blue lines). Cash is currently at 75 basis points (0.75%) and was subsequently cut to 50 basis points (0.5%) in March.
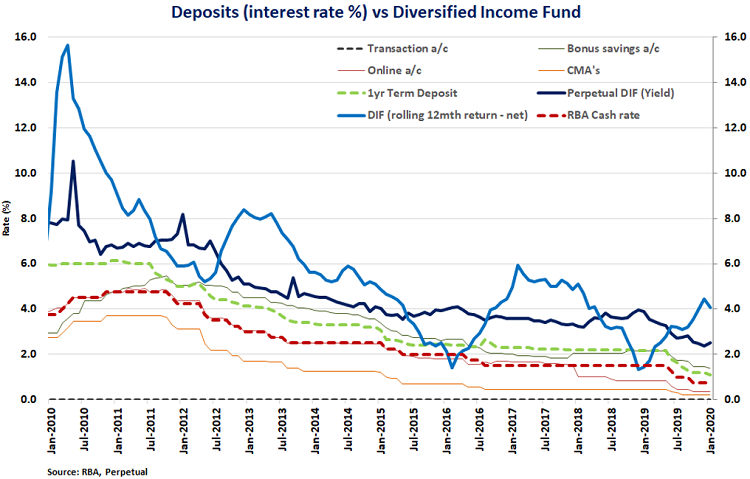
The green line dotted line is the one-year term deposit rate, which fell substantially recently. Part of the reason is that as we approach the lower bound of interest rates close to zero, banks are unable to pass on those rate falls to some of their deposit accounts which are already close to zero. It leaves the TDs to do the heavy lifting for the banks’ net interest margin. The average today is about 1.2% for 12 months (which would be even lower following the 25 basis point RBA rate cut in March), so depositors are not even maintaining a real return above inflation (1.8%).
That’s where a fund like the Diversified Income Fund plays a role. The dark blue line above shows the running yield of the portfolio, currently 2.5%. But 4% is the actual net return on the portfolio with value added by active management over the year.
GH: And on a mark-to-market basis, it looks like a loss in November and December 2018.
VP: Yes, from the widening credit spreads already discussed, we had a negative return in those two months. But the light blue line is a rolling 12-month net return, and over the last 10 years, the return has been below TDs in only 10 months in the period since 2010. That’s 115 months of history and over 90% of the time, the Diversified Income Fund has delivered a rolling 12-month return better than term deposits.
GH: Is that after fees, and what are the fees?
VP: 70 basis points (0.7%) if someone comes in through Perpetual. Unlike term deposits, this Fund also offers daily liquidity, plus a positive real return.
Our active approach to credit investing is based on relative valuation, which is why we do this sort of analysis. Studying different credit ratings bands or different parts of the capital structure, allows us to identify where the best value is and where the risks are.
Graham Hand is Managing Editor of Firstlinks, of which Perpetual Investments is a sponsor. This article is general information and does not consider the circumstances of any investor. The margins and analysis are as at mid-February 2020, and since the interview, markets have experienced significant changes. Nevertheless, the general lessons in managing a fixed interest portfolio remain valid.
For more articles and papers from Perpetual, please click here.