Historical patterns can provide a useful roadmap for the future but can sometimes lead to mistaken assumptions. People tend to look to the past to make sense of the present and the future. During bear markets, a wildly overused, and I believe, dangerous, frame of reference is historical drawdowns (losses) and their implied assumptions about future market returns.
For example, a widely-used formula goes like this: Recessions last an average of w number of days, and equities fall an average of x% followed by a recovery of y% in z days. Market commentators use formulas such as these to ease clients’ mental anguish and imply that better days are ahead. Better days are ahead. However, they can take longer than experts expect to materialise and may be accompanied by significant financial pain.
The problem with averages
Averages tell us the central or typical value in a data series but provide no window into variation. For example, two cities may share an average annual temperature of 70°F, but if one is in a temperate climate where the temperature is quite steady and the other experiences significant seasonality, the average doesn’t tell you much. More data are needed to decide when to visit one city and when to visit the other.
Apart from the problem with simple averages, every market drawdown, financial crisis and recession is different. Even if historical market drawdown averages were accompanied with pages of data, would that help? I don’t think so.
Recessions wring out excesses
Economic and market cycles don’t die of old age. They end when excesses are corrected due to a financial crisis or a recession. These, often painfully, wring out overinvestment in both the real economy and financial markets. The length of the business cycle is irrelevant. What matters is the level of excess and the magnitude of the needed rebalancing process. That determines how much further we may still have to fall.
To get a sense of where past excesses lay, look no further than to whomever was Wall Street’s favourite client at the time. For example, in the 1990s it was the dot-com companies. The Street’s favourite (and most profitable) clients were companies with a concept leveraged to the internet, seeking capital. In the 2000s, the preferred clientele was financial institutions looking for enhanced yield without excess risk. The Street sold them mortgage-backed securities consisting of repackaged loans made to American homeowners who were unable (or unwilling) to fulfill their obligations. That led to the GFC.
The time required to heal following the internet bubble and housing crisis is unrelated to the next recession. Different imbalances require different corrective processes. The level of the drawdown in the S&P 500 or MSCI EAFE back then is no longer the issue.
What matters today is whether the real economy and financial markets have cleared the excesses built up since the last recession.
Where are today’s excesses?
The policy response to low growth and deflation risks during the 2010s was quantitative easing. Central bankers expected it to lead to capital creation and corporate borrowing to fund productive activities. It didn’t, because money-debasing signaled weak growth prospects to producers. Borrowed money instead went to pay dividends and repurchase stock. Quantitative easing turned out to be the problem masquerading as the solution.
Wall Street’s favourite clients in the post-GFC era were non-bank companies. Financial leverage among that group reached new heights before the pandemic and exceeded those highs once central banks turned the lending spigot back on in April 2020, unlocking credit markets.
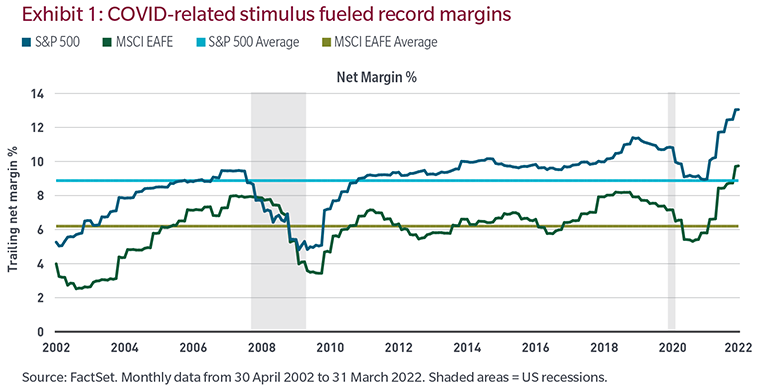
As I wrote back in April, despite the weakest economic cycle in over a century, corporate profit margins reached all-time highs in 2018, only to be surpassed in 2022 due to the lagged effects of an over-stimulated world economy. How? Debt is a pull-forward of future capacity, and companies pulled forward an unsustainable amount of margin and profit.
We don't believe corporate margins will be sustained
Margins and profits ultimately drive stock and credit prices. The headline “S&P 500 on track for the worst start of the year since 1970,” is dramatic but misses the point. What will drive future returns is profits.
Currently, many companies are telling investors they can sustain all-time-high post-stimulus margins despite rising fears of recession and a step-function jump in costs (explaining why earnings expectations remain elevated in the face of obvious revenue and input cost pressures), but we don’t believe them.
Risk is usually hidden in plain sight. What do your eyes tell you?
Robert M. Almeida is a Global Investment Strategist and Portfolio Manager at MFS Investment Management. This article is for general informational purposes only and should not be considered investment advice or a recommendation to invest in any security or to adopt any investment strategy. Comments, opinions and analysis are rendered as of the date given and may change without notice due to market conditions and other factors. This article is issued in Australia by MFS International Australia Pty Ltd (ABN 68 607 579 537, AFSL 485343), a sponsor of Firstlinks.
For more articles and papers from MFS, please click here.
Unless otherwise indicated, logos and product and service names are trademarks of MFS® and its affiliates and may be registered in certain countries.