Inflation, the RBA, wage growth, house prices... Australian investors spend so much time navigating domestic indicators that we may lose sight of the bigger picture. It is easy to get bogged down by every data release and policy debate, but sometimes the most useful perspective comes from stepping back and asking a simpler question - How do we compare with the rest of the world?
Deutsche Bank’s Mapping the World’s Prices 2026 helps bring these comparisons to the forefront, quantifying exactly what has changed over the past decade on a relative basis. This report covers 69 cities across 6 continents with prices converted to US dollars. An important thing to note is that only Melbourne and Sydney are included in this dataset.
The post-Covid inflation scorecard
Most of the time there is some amount of inflation. When the report started in the 2010s inflation was largely subdued in developed markets.
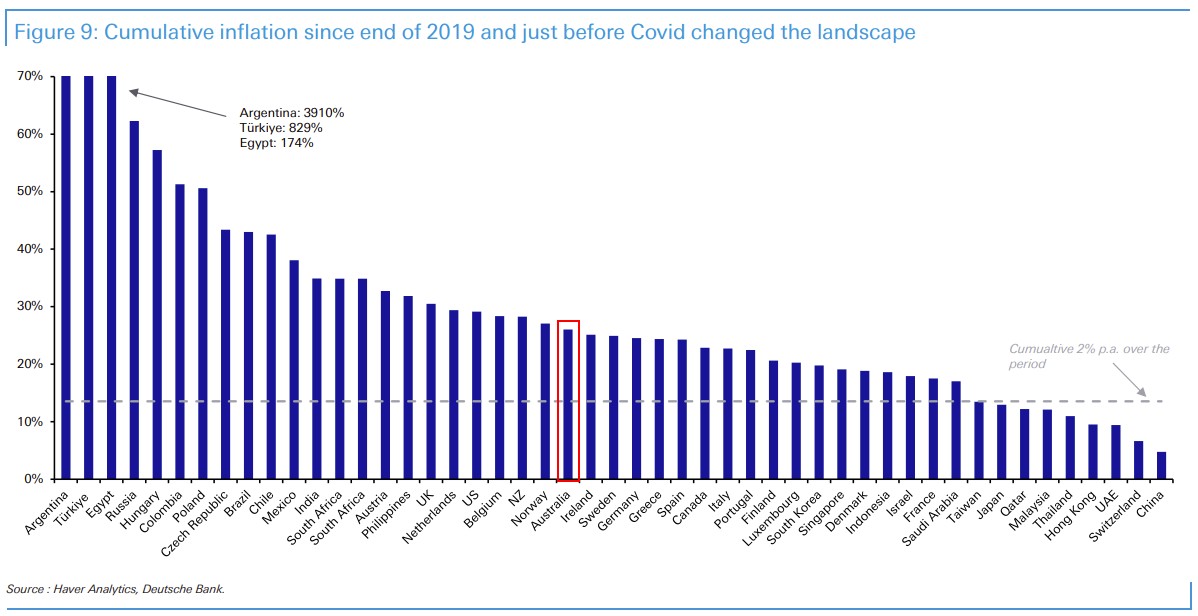
However, since Covid global inflation is well and truly back and is shaping relative prices and currencies everywhere. Cumulative CPI inflation since 2019 reveals where the cost of living has risen most in local currency terms, stripping out FX effects. Australia sits somewhere in the middle of this pack at around 30%.
Purchasing power parity
Since this report was first published in 2012 there have been big swings in inflation, growth, prices and exchange rates but one of the main enduring trends has been that the US has become notably more expensive and Japan has travelled from expensive to very cheap.
Purchasing power parity (PPP) is an economic measure used to faithfully compare living standards across exchange regions by eliminating the influence of different local price levels. Over this period on a PPP basis, the US has gotten more expensive relative to every economy covered in the report. Australia on the other hand has cheapened considerably, dropping from around 160 in 2012 to 100 in 2025, but still ranks high on a PPP basis.
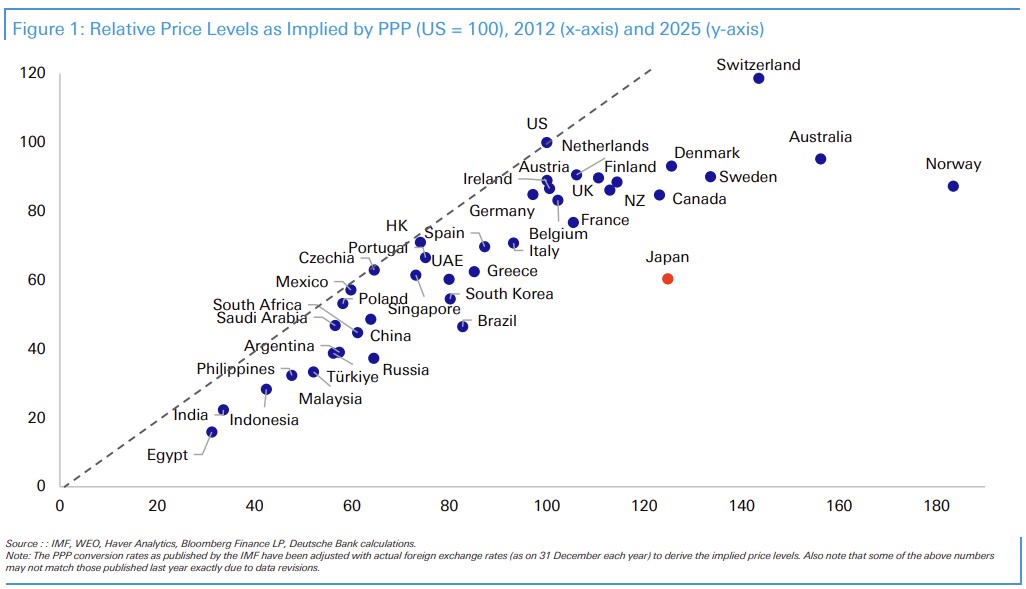
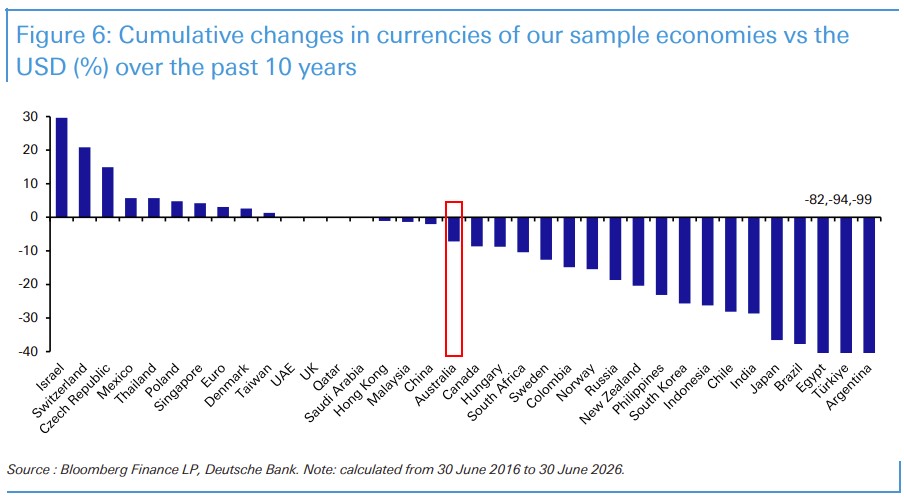
Over a decade ago, Australia was one of the most expensive economies in the world, buoyed by a strong dollar and mining-boom wages. Today it sits much closer to the US benchmark, reflecting a long-term depreciation of the AUD.
Quality of life
The quality-of-life index combines purchasing power, safety, healthcare, cost of living, property-price-to-income ratio, commute time, pollution, and climate into a single score.
To the surprise of very few, Luxembourg, Copenhagen and Amsterdam top the list, retaining their rank from the previous year. Despite salary dominance, no US city makes the top 10 for quality of life, but it is important to note that there is much dispersion. New York ranks at 46th while Boston (17th) and San Francisco (21st) are comfortably in the top half of the list. The report cites a combination of high costs, long commutes and safety concerns keep American cities out of contention for the top 10.
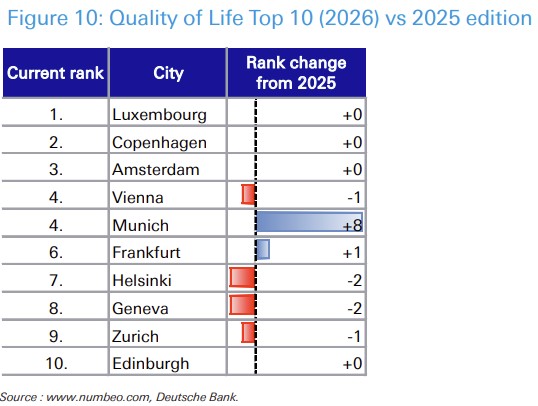
Australia continues to score well on this front. Melbourne and Sydney remain globally competitive, both making it into the top 15. London and New York reside towards the bottom of the list, ranking 46th and 47th respectively, with very similar scores on the Safety, Cost-of-living and Traffic Commute Time measures.
Salaries and disposable income
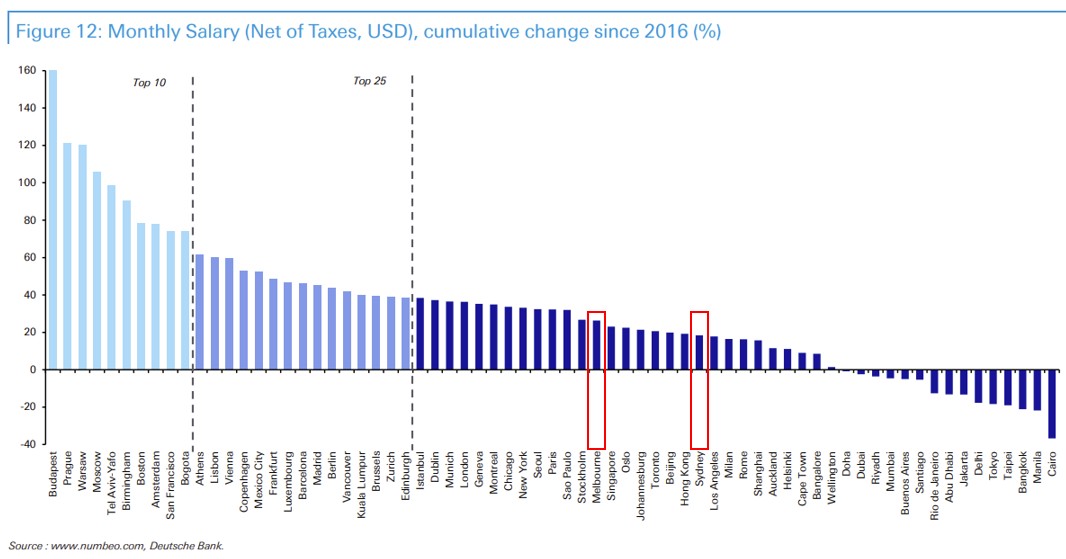
On the domestic front, salary growth has moderately lagged inflation at a cumulative increase of ~20% for Melbourne since 2016. Notably, several Central European cities have enjoyed strong wage growth with salaries in Budapest, Prague and Warsaw doubling in 10 years, outpacing every major developed market city the report tracks.
On the topic of disposable income after rent, the index measures two people working and renting a three bedroom apartment. the data shows a meaningful drop in disposable income since 2016 for both Sydney and Melbourne.
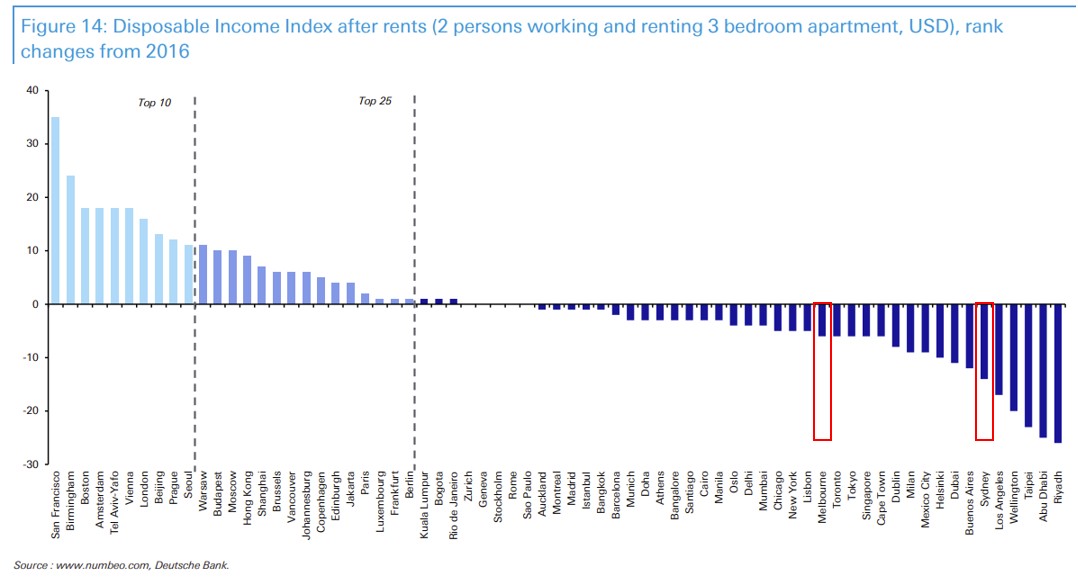
Though we see a major divergence between the two cities where Melbourne ranks 9th and Sydney falls at 29th overall. One could perhaps attribute this to the Melbourne rental market being significantly cheaper than Sydney's.
Public transport and the 'sin tax'
As someone who regularly commutes via public transport, the costs sometimes feel extortionate. I was somewhat validated in finding out that Sydney is indeed the second most expensive for public transport coming out at US$150 for a monthly pass, surpassed only by London at over US$250.
The report also cites Melbourne ($111.2) as the world's most expensive city for cigarettes and beer, continuing Australia's relentless application of sin taxes, with Sydney second. Over a decade, Melbourne's Oasis index has risen +89%. Our Kiwi cousins across the pond, Auckland and Wellington, rank 3rd and 4th respectively.
This note only highlights select findings from the report. For those after the full version from Deutsche Bank, it can be found here.
Simonelle Mody
Also in this week's edition...
On superannuation we have Marcus Padley revealing the most common SMSF mistakes that can end up being quite costly. UniSuper’s Matt Werakso wants to help retirees navigate super’s complexity and be able to confidently use their savings to support security, wellbeing and choice. Trevor Schmid crunches the numbers on what it takes to replace market losses in super when rules and caps stand in the way.
Tony Dillon has picked up on an almost unnoticed consequence of Labor’s capital gains tax changes, which raises bigger questions.
While markets obsess over AI winners, Tim Humphreys from Ausbil has been finding the quiet, durable assets evolving beneath the AI story.
We also hear from Christine Benz and why it’s a mistake to rely on “hitting a number” for retirement.
Last week’s edition led with an article from Rachel Rofe on discretionary testamentary trusts, and due to its popularity, we are keeping this one on the home page for another week.
Our featured white paper is Dexus Research’s quarterly review of Australia’s Real Asset sector.
Curated by Simonelle Mody and Leisa Bell
***
Weekend market update
From Shane Oliver, AMP
Global shares came under pressure again over the last week as the Iran War escalated further with Trump talking of a “massive attack”, oil prices surged, expectations for central bank rate hikes rose, the Trump Administration announced more tariffs and IT shares were hit again with worries about the sustainability of AI related earnings and valuations, despite strong earnings results. In terms of the latter on Thursday the Magnificant Seven group of tech stocks fell 4.8%. Combined this saw US and European shares fall. Japanese and Chinese shares came under pressure later in the week but managed modest gains and the AI exposed Korean sharemarket gave up some of its rebound. Renewed global worries weighed on the Australian share market which fell around 0.3%, but with its lower exposure to tech shares providing some protection. Tech, property and mining shares led the falls on the ASX but were partly offset by gains in energy and financial shares.
Bond yields surged over the last week on worries about higher inflation and more rate hikes with Australian and UK 10-year bond yields pushing back above 5%. Iron ore and gold prices fell, but copper prices rose as did Bitcoin although it remains shaky given the softness in shares and a rise in the $US. The latter saw the $A fall back below $US0.70.
The past week has seen a further signficant military escalation in the US/Iran conflict, the Strait of Hormuz remaining effectively closed again and Iran backed Houthis reportedly targeting Saudi shipping in the Red Sea which goes out via the Bab el-Mandeb Strait to the south or the Suez Canal to the north. If the Bab-el-Mandeb Strait is fully blocked oil can get out through the Suez Canal or through an associated pipeline to the Mediteranean but to get to Asia it then has to travel around Africa adding to costs. So the Houthis intervention potentially threatens up to 7 million barrels per day of oil supplies which had been diverted through the Saudi East-West pipeline rather than have to go through Hormuz.
The signficant escalation in the War and increased disruption to oil supplies has seen oil prices rise further with Brent now back above $US100/barrel – note that intra day Brent and West Texas spiked to around $US1.20 a barrel earlier in the War so we are still below that. But so far this month oil prices are up around $US30/barrel.
The ongoing escalation in the US/Iran War raises the risk again of a bigger stagflationary hit to the global and Australian economies. So far markets seem relatively relaxed with oil prices up sharply from June lows but still below their highs a few months ago and share markets have not had big falls yet. This likely reflects the view that the world can continue to run down reserves, profit growth has been strong and expectations that Trump will sooner or later announce another peace deal capping the spike in oil prices. Another TACO deal is our base case too as a rebound in US gasoline prices which are now back above $US4/gallon will crash Trump’s already low approval rating and the Republicans’ ability to keep the Senate in the mid-terms. Iran may also go along with another deal to buy some more time.
However, the risk is high that there will be no deal and that we will have to face ever higher oil prices as reserves run down – the US Strategic Petroleum Reserve is at its lowest since 1983 and it’s unclear how long China can continue to run on sharply reduced imports - and the global economy has to face a day of reckoning requiring the demand for oil to have fall back to match the fall in daily production levels. This could mean oil prices up to $US150-200 a barrel. It’s not our base case but it’s a high risk again. Ukrainian hits on Russian refineries arguably also now add to the upside risks to global refined oil product prices, particularly diesel.
The combination of surging oil prices, increasing pressure on central banks to raise rates, rising bond yields, AI earnings and valuation worries along with another ramp up in tariff noise leaves shares at high risk of another correction. Much of this turbulence is at the hands of President Trump, highlighting the risks he poses to the economic outlook – in terms of more inflation and less growth – and the threat that poses to share markets. Of course, just as Australian shares didn’t get much benefit on the way up in the AI boom they may not fall as much if and when it does really start to unwind.
In Australia, petrol prices have risen from the 30 June low of around $1.53 a litre to now around $1.82 and could be above $2 early next month. The rise so far reflects +16 cents a litre from the halving of the 32 cents a litre fuel tax cut from 1 July and some flow through of the $US30 a barrel rebound in oil prices. But the rebound in oil prices is yet to fully flow through and at current levels alone could add around another 10 cents a litre to petrol prices. So far, the Treasurer has said that the remaining 16 cents a litre fuel tax cut “will taper off in the first couple of days of August”. If so, it could mean another 26 cents a litre at least added on to petrol prices.
We remain of the view that the RBA will have to raise rates again. Canadian and UK underlying inflation at 1.8% and 2.6% respectively for June released in the last week highlight how out of whack we are globally with underlying inflation at 3.6%yoy in May. Of course, both these countries have higher unemployment at 6.5% and 4.9% which may partly explain the difference compared to 4.4% in Australia. But the problem for the RBA is that the rebound in oil prices with a potentially greater flow through to underlying inflation will see inflation potentially stay higher for longer, threatening higher inflation expectations making it even harder to get inflation back to target. This is already a big worry as, including this year, inflation will have been above the 2-3% target for five the last six years, which risks blowing the credibility of the inflation target.
Jobs data for June was mixed but will likely still see the RBA characterise the labour market as a “bit tight” which in turn should clear the way for another rate hike next month. So, our base remains for an August rate hike, but with uncertainty about the growth outlook and home prices falling we see it as a close call. However, we would still see a further hike as being necessary this year even if the RBA does decide to pause so as to “wait and see” again next month. Next week’s inflation data for June will be key though. Another rise in trimmed mean inflation to 3.7%yoy or more will reinforce the case for another hike whereas an outcome around 3.5%yoy or less could weaken it.
RBA survey findings that only 25% of people correctly assess that higher interest rates will ultimately slow inflation and more than 50% think it will add to inflation are not particularly surprising. I have even had colleagues who think that! But it does mean that the RBA has to hike more than otherwise would have been the case if more understood how interest rates impact inflation. Which in turn highlights the need for more economic and financial literacy in Australia. But I doubt Australia is much different to other comparable countries in this regard.
Meanwhile with around two thirds of respondents citing inflation as their main concern, and this particularly being the case amongst lower income households, the RBA is right to be focussed on getting it back down, ie not just because it’s part of their mandate.
Latest updates
PDF version of Firstlinks Newsletter
Investment update with John Pearce by UniSuper
Listed Investment Company (LIC) Indicative NTA Report from Bell Potter
ASX Listed Bond and Hybrid rate sheet from NAB/nabtrade
Plus updates and announcements on the Sponsor Noticeboard on our website