Register For Our Mailing List

Register to receive our free weekly newsletter including editorials.

Home / 116

A year of good returns and low volatility

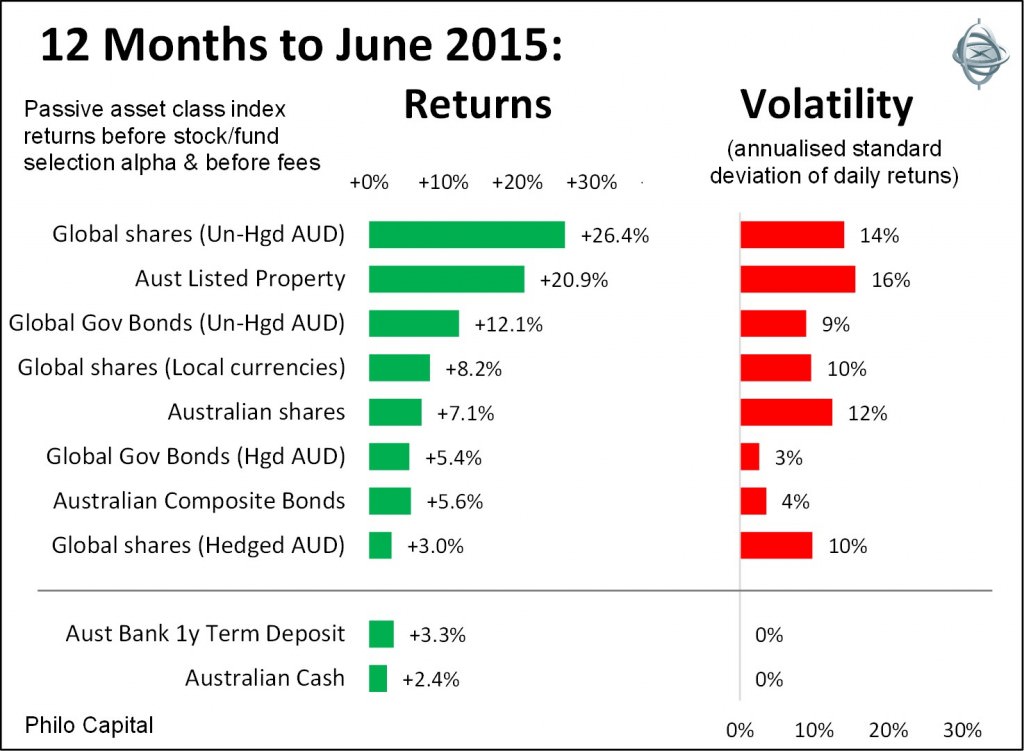
The past 12 months have been kind to long term investors, with all asset classes generating positive returns well above inflation and cash rates, and with lower than average volatility. The chart shows passive asset class index (accumulation) returns for the 12 months to the end of June 2015 before fees.

All asset classes have done well, even ‘defensive’ bonds, but how long will it last? The dominant factors remain the same – the course of the European debt crisis and the pace of US interest rate hikes. The ECB and IMF appear ready to support banks and credit markets whether Greece leaves the Eurozone or stays. Also, the US Fed appears to be bending over backwards to ensure rate hikes are as slow and as well-signalled as possible, to limit the impact on business investment, consumer spending, mortgage interest rates, and markets.

Australia

The most interesting development in macro policy in June 2015 was the public debate over Sydney house prices – whether or not they are too high, and whether or not they are preventing the RBA from cutting interest rates further. Recall that the price boom took off when RBA Governor Glenn Stevens started cutting interest rates in November 2011 with the stated intention of lifting prices in the hope that a housing construction boom might fill the hole left by the mining construction boom that has ended. Stevens now says the resultant ‘crazy’ house prices should not prevent him from cutting cash rates even further to try to bring down the dollar. The dollar would be lower were it not for the demand due to the flood of foreign money chasing residential and non-residential properties. Making further rate cuts more unlikely is the strong labour market, with the unemployment rate dropping unexpectedly to 6% on solid jobs growth. Another dampener was the relatively strong March quarter economic growth numbers released during the month.

Europe

Greece’s dire debt situation continues to deteriorate. It has been fascinating watching the ECB and IMF come up with new creative ways to allow Greece to default (ie fail to pay interest or principal when due) without actually calling it a ‘default’. Everybody, including the Greek government, knew the only way it could make payments would be with even more IMF debt that would be released if Greece agreed to a ‘cash for reform’ deal. The ECB and IMF finally have their heads out of the sand and are now openly planning how to remove Greece without making it too easy for others to follow. Aside from the Greek problem, the rest of Europe appears to be on the mend. Fears of deflation are receding and confidence and spending are rising, as is manufacturing production.

US

During June the March quarter economic growth numbers were revised downward to a contraction, caused largely by a huge trade deficit, in turn caused by the high US dollar driven up by investors preparing for upcoming US interest rate hikes. But data for the June quarter has been stronger. Retail sales are looking up and new building approvals are strong. Household incomes, spending and confidence are also improving solidly. The unemployment rate at 5.5% is continuing its slow decline since peaking at 10% in October 2009, and CPI inflation still running at zero, well below its post-GFC high of 3.9% in August 2011. Fed chair Janet Yellen appears to be signalling a start to rate hikes in the fourth quarter this year.


Ashley Owen is Joint CEO of Philo Capital Advisers and a director and adviser to the Third Link Growth Fund. This article is educational only. It is not personal financial advice and does not consider the circumstances of any individual.


8 Comments
Ashley
July 03, 2015

By its nature, the Accumulation index is hard to calculate. S&P/ASX show 47,272.1 for 30 June 2015, Bloomberg shows 47,574.9, but I calculate 48,203.1 (but probably based on incorrect S&P data). ASX outsourced data years ago. Sometimes S&P revises index numbers later, particularly after month end or quarter end. It is always a nightmare!

Jerome Lander
July 03, 2015

One thing readers may not have noticed is the high volatility from Australian listed property (16% versus just 12% for Australian shares). A lot of people mistakenly invest in listed property thinking it is lower volatility exposure than the broader category of Australian shares. Notably increasing volatility from listed property was last seen just before the GFC.

Readers should also be aware that volatility in the last year in equities in particular has been significantly lower than long term averages and that index investors should expect much higher volatility in the coming year than what has been experienced in the last one, which may well correspond with weaker returns. More active and prudent investing looks increasingly attractive in that context.

Ken Ellis
July 03, 2015

Letter to the Editor: Is Australia becoming the next Greece? What are the morals of parliamentarians who will commit our defence forces to possible death to protect the future of Australia while they won’t risk their future incomes for the same task? What are the morals of parents and grandparents who vote to protect their short term gain at the expense of their children’s future? What are the morals of parliamentarian’s that blatantly support the interests of the groups that provide the largest sums of money for their re-election? What are the morals of a country where the non-financial contributing people get almost the same amount of income as a large number of working and taxpaying members of the community? Would out parliamentarians be at home in the Greek parliament? What is your contribution as a voter to the above challenges?

Marcus Padley
July 02, 2015

Because the Accumulation index is a bit of a fantasy index in that it compounds dividends perfectly without costs - a process that is almost impossible in real life - I despair for fund managers (and spouses!) that choose it as a benchmark nd get compared to it - the average fund manager will always underperform compared to the accumulation index because they have costs, rent, employees. Compounding is also a process that very few investors actually do. So people like to know both numbers. It is also customary to quote the non accumulation number.

Dave Osborne
July 03, 2015

Completely agree. Wilson Asset Management quote it at 5.7%. As a simple SMSF trustee how o I measure my return compared to a benchmark when the experts differ?

ashley
July 02, 2015

Hi greg
I find that most commentators are more interested in the noise in the daily markets. But long term investors like me are only interested in the big things that matter. And they only change once or twice a year if that. I try to remove the emotion from investing and focus just on the facts. If we ignore the daily noise we see that returns have been good and volatility has been low. While both shares and bonds have done well l, being over-weight shares and avoiding the noise has paid off. I have learned that the less i listen to the daily chatter the better.
Cheers
Ashley

PM 1957
July 02, 2015

AK and his nightly graphs continue to entertain the informed and paralyze the herd ......

Greg
July 02, 2015

On 30 June, Alan Kohler appeared on ABC News and said the market was up only 2.5% for the year, barely above inflation. Why do people quote this number when it is not an accurate reflection of the return from shares, which on Ashley's numbers, the accumulation index, is more like 7%. That's the number we want to know.


Leave a Comment:

RELATED ARTICLES

US debt, the weak AUD and the role of super funds

In a short-term world, take a longer-term view

Can Australian credit continue to perform?

banner

Most viewed in recent weeks

Australian house prices close in on world record

Sydney is set to become the world’s most expensive city for housing over the next 12 months, a new report shows. Our other major cities aren’t far behind unless there are major changes to improve housing affordability.

The case for the $3 million super tax

The Government's proposed tax has copped a lot of flack though I think it's a reasonable approach to improve the long-term sustainability of superannuation and the retirement income system. Here’s why.

7 examples of how the new super tax will be calculated

You've no doubt heard about Division 296. These case studies show what people at various levels above the $3 million threshold might need to pay the ATO, with examples ranging from under $500 to more than $35,000.

The revolt against Baby Boomer wealth

The $3m super tax could be put down to the Government needing money and the wealthy being easy targets. It’s deeper than that though and this looks at the factors behind the policy and why more taxes on the wealthy are coming.

Meg on SMSFs: Withdrawing assets ahead of the $3m super tax

The super tax has caused an almighty scuffle, but for SMSFs impacted by the proposed tax, a big question remains: what should they do now? Here are ideas for those wanting to withdraw money from their SMSF.

The super tax and the defined benefits scandal

Australia's superannuation inequities date back to poor decisions made by Parliament two decades ago. If super for the wealthy needs resetting, so too does the defined benefits schemes for our public servants.

Latest Updates

Planning

Will young Australians be better off than their parents?

For much of Australia’s history, each new generation has been better off than the last: better jobs and incomes as well as improved living standards. A new report assesses whether this time may be different.

Superannuation

The rubbery numbers behind super tax concessions

In selling the super tax, Labor has repeated Treasury claims of there being $50 billion in super tax concessions annually, mostly flowing to high-income earners. This figure is vastly overstated.

Investment strategies

A steady road to getting rich

The latest lists of Australia’s wealthiest individuals show that while overall wealth has continued to rise, gains by individuals haven't been uniform. Many might have been better off adopting a simpler investment strategy.

Economy

Would a corporate tax cut boost productivity in Australia?

As inflation eases, the Albanese government is switching its focus to lifting Australia’s sluggish productivity. Can corporate tax cuts reboot growth - or are we chasing a theory that doesn’t quite work here?

Are V-shaped market recoveries becoming more frequent?

April’s sharp rebound may feel familiar, but are V-shaped recoveries really more common in the post-COVID world? A look at market history suggests otherwise and hints that a common bias might be skewing perceptions.

Investment strategies

Asset allocation in a world of riskier developed markets

Old distinctions between developed and emerging market bonds no longer hold true. At a time where true diversification matters more than ever, this has big ramifications for the way that portfolios should be constructed.

Investment strategies

Top 5 investment reads

As the July school holiday break nears, here are some investment classics to put onto your reading list. The books offer lessons in investment strategy, financial disasters, and mergers and acquisitions.

Sponsors

Alliances

© 2025 Morningstar, Inc. All rights reserved.

Disclaimer
The data, research and opinions provided here are for information purposes; are not an offer to buy or sell a security; and are not warranted to be correct, complete or accurate. Morningstar, its affiliates, and third-party content providers are not responsible for any investment decisions, damages or losses resulting from, or related to, the data and analyses or their use. To the extent any content is general advice, it has been prepared for clients of Morningstar Australasia Pty Ltd (ABN: 95 090 665 544, AFSL: 240892), without reference to your financial objectives, situation or needs. For more information refer to our Financial Services Guide. You should consider the advice in light of these matters and if applicable, the relevant Product Disclosure Statement before making any decision to invest. Past performance does not necessarily indicate a financial product’s future performance. To obtain advice tailored to your situation, contact a professional financial adviser. Articles are current as at date of publication.
This website contains information and opinions provided by third parties. Inclusion of this information does not necessarily represent Morningstar’s positions, strategies or opinions and should not be considered an endorsement by Morningstar.