Register For Our Mailing List

Register to receive our free weekly newsletter including editorials.

Home / 639

Are excessive super funds giving Australia “Dutch Disease”?

Dutch Disease explained

Dutch Disease, coined following the Netherlands’ natural gas discoveries in the 1960s, describes an economic phenomenon where a resource boom paradoxically weakens a nation’s broader economic competitiveness. The mechanism operates through two channels: the spending effect, where increased income from the booming sector drives up domestic prices and wages, and the resource movement effect, where capital and labour shift from manufacturing to the resource sector. The result is an appreciated currency that makes tradeable goods sectors—particularly manufacturing—internationally uncompetitive, leading to premature deindustrialization.

The superannuation leviathan

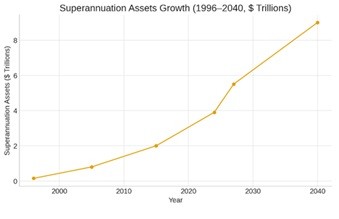
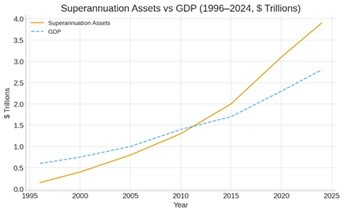
Australia’s compulsory superannuation system has created an investment behemoth of staggering proportions. As of September 2024, total superannuation assets reached approximately $3.9 trillion, representing roughly 140% of Australia’s GDP. This figure has grown exponentially from $148 billion in 1996, demonstrating a compound annual growth rate exceeding 12% over nearly three decades.

To contextualize this scale: Australia’s superannuation pool is the fourth-largest pension market globally, behind only the United States, United Kingdom, and Japan—nations with populations 13x, 2.6x, and 5x larger respectively. On a per capita basis, Australia’s $150,000 per person in retirement savings dwarfs comparable economies.

The system’s growth trajectory remains formidable. With the Superannuation Guarantee rising from 11% to 12%, and an ageing population entering peak accumulation years, industry projections suggest assets could reach $5.5 trillion by 2027 and potentially $9 trillion by 2040.

Capital deployment and market distortions

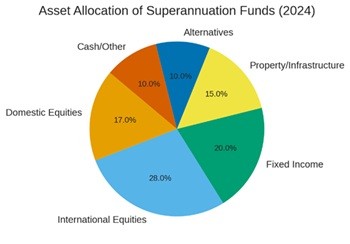
Australian superannuation funds deploy capital across diversified portfolios, but their sheer magnitude creates structural market impacts. As of 2024, approximately 45% of superannuation assets are invested in equities—roughly $1.75 trillion. Of this, domestic Australian equities make up approximately $600-650 billion, while international equities account for $1.1-1.15 trillion.

Domestic equity market inflation

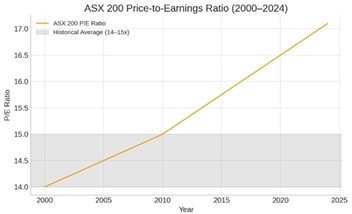
The ASX’s total market capitalization stands at approximately $2.6 trillion, meaning superannuation funds own roughly 25% of the entire Australian equity market. This persistent, mandated bid has compressed risk premiums and inflated valuations beyond fundamental justifications. The ASX 200’s price-to-earnings ratio has averaged 17-18x over the past five years, elevated compared to historical averages of 14-15x prior to 2010. At present, the forward PE is 19x, close to the top of its historic range.

Index concentration exacerbates this distortion. The Big Four banks and major miners represent approximately 40% of the ASX 200 by market weight, creating a feedback loop where superannuation inflows disproportionately inflate a narrow subset of large-cap stocks, regardless of underlying business conditions. We have observed this most recently with the pricing of Commonwealth Bank shares, which hit a peak of $192, pricing them well above virtually any comparable bank in the world.

Currency appreciation dynamics

The superannuation system’s offshore investment component—approximately $1.1 trillion—requires initial AUD conversion, but subsequent repatriation of dividends, distributions, and rebalancing flows creates ongoing upward pressure on the Australian dollar. Australian funds have become significant owners of global equities, with estimates suggesting they hold $150-200 billion in US equities alone.

With the boom in Artificial Intelligence mega-cap stocks in the US, our super savings are highly vulnerable should the AI boom eventually burst.

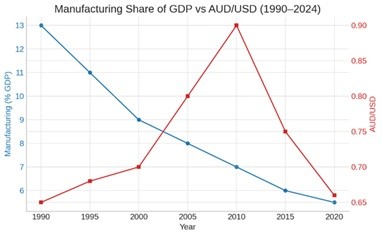
This capital round-tripping—where compulsory domestic savings flow offshore then return as income—mimics the resource boom’s currency effects. The AUD has traded structurally higher post-2000, averaging USD 0.75 compared to USD 0.65 in the 1990s. While commodity prices explain part of this appreciation, persistent superannuation-driven capital flows provide an underlying structural bid.

The manufacturing hollowing

Australia’s manufacturing sector has contracted dramatically, falling from 13% of GDP in 1990 to just 5.5% in 2024. Employment in manufacturing has declined from 1.3 million workers in 1990 to approximately 900,000 today, despite population growth of 60% over this period.

The elevated currency makes Australian-produced goods internationally uncompetitive. A persistently strong AUD, supported by both commodity exports and superannuation-driven capital dynamics, functions as a tax on exporters and a subsidy to importers. Tradeable goods sectors cannot compete when labour costs remain high in AUD terms but translate to uncompetitive rates in foreign currency. Fortunately, the AUD has recently been trading at the relatively subdued level around US$0.66.

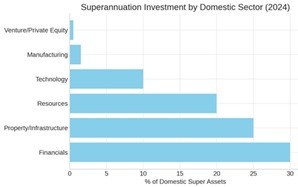
Meanwhile, superannuation funds themselves show minimal appetite for direct manufacturing investment. Less than 2% of superannuation assets flow toward direct private equity or venture capital in domestic industrial enterprises. Instead, capital clusters in financial services, property, infrastructure monopolies, and offshore markets—sectors either shielded from international competition or benefiting from the very currency strength undermining manufacturers.

Conclusion: A self-reinforcing cycle

Australia’s superannuation system, while achieving its retirement adequacy objectives, may indeed be inducing Dutch Disease dynamics. The mandated accumulation of $3.9 trillion creates structural market distortions: inflated domestic equity valuations, persistent currency appreciation, and capital starvation for internationally exposed manufacturing. Like natural resource wealth, excessive financial asset accumulation can hollow out productive tradeable sectors, leaving the economy dangerously specialized and vulnerable to financial market corrections.

The irony is profound: a system designed to secure Australians’ futures may be systematically dismantling the economic diversity necessary for long-term prosperity.


Paul Zwi is a Portfolio Strategist at Clime Investment Management Limited, a sponsor of Firstlinks. The information contained in this article is of a general nature only. The author has not taken into account the goals, objectives, or personal circumstances of any person (and is current as at the date of publishing).

For more articles and papers from Clime, click here.


  •   26 November 2025
  • 5
  •      
  •   
5 Comments
Dudley
November 30, 2025


"12% was never needed- 10% was always going to be sufficient":

In units of gross annual income, wage replacement over retirement:

= FV((1 + (1 - 15%) * 10.45%) / (1 + 2.5%) - 1, (67 - 25), -12% * 1, 0)
= 22.44

= PMT((1 + (1 + 0%) * 4.5%) / (1 + 2.5%) - 1, (97 - 67), -22.44, 0)
= 1.00

John
November 30, 2025

The best thing about the excessive 12% SGC is the aged pension's assets test will ensure almost no-one qualifies on retirement for the pension in a few decades, assuming current legislation does not radically change.

Dudley
December 01, 2025


"will ensure almost no-one qualifies on retirement for the pension in a few decades":

Depends strongly on real net compounding rate of return.
Less than ~4% results in withdrawals less than age pension.

Peter
December 03, 2025

There are other reasons for manufacturing decline. The offshoring to China of production and the very small market for manufactured goods are other possible causes, not just super and stuff we dig up and flog off.
Conflating the structural issues of huge savings requiring decent returns and value stability with the collapse of internal manufacturing is a mistake as the reasons are complex, and not isolated to Australia. Cheap renewable power may drive an increase in high tech manufacturing and data factories and provide a reasonable investment opportunity for that cash. Until there's a stable consistent political approach, it ain't happening soon enough.


Leave a Comment:

RELATED ARTICLES

Why I’m not ready for an SMSF

SMSF returns competitive with big funds at $200,000

How to access money under the First Home Super Saver

banner

Most viewed in recent weeks

Building a lazy ETF portfolio in 2026

What are the best ways to build a simple portfolio from scratch? I’ve addressed this issue before but think it’s worth revisiting given markets and the world have since changed, throwing up new challenges and things to consider.

Australian stocks will crush housing over the next decade, 2025 edition

Two years ago, I wrote an article suggesting that the odds favoured ASX shares easily outperforming residential property over the next decade. Here’s an update on where things stand today.

Get set for a bumpy 2026

At this time last year, I forecast that 2025 would likely be a positive year given strong economic prospects and disinflation. The outlook for this year is less clear cut and here is what investors should do.

Meg on SMSFs: First glimpse of revised Division 296 tax

Treasury has released draft legislation for a new version of the controversial $3 million super tax. It's a significant improvement on the original proposal but there are some stings in the tail.

Ray Dalio on 2025’s real story, Trump, and what’s next

The renowned investor says 2025’s real story wasn’t AI or US stocks but the shift away from American assets and a collapse in the value of money. And he outlines how to best position portfolios for what’s ahead.

Property versus shares - a practical guide for investors

I’ve been comparing property and shares for decades and while both have their place, the differences are stark. When tax, costs, and liquidity are weighed, property looks less compelling than its reputation suggests.

Latest Updates

Economy

Ray Dalio on 2025’s real story, Trump, and what’s next

The renowned investor says 2025’s real story wasn’t AI or US stocks but the shift away from American assets and a collapse in the value of money. And he outlines how to best position portfolios for what’s ahead.

Superannuation

No, Division 296 does not tax franking credits twice

Claims that Division 296 double-taxes franking credits misunderstand imputation: franking credits are SMSF income, not company tax, and ensure earnings are taxed once at the correct rate.

Investment strategies

Who will get left holding the banks?

For the first time in decades, the Big 4 banks have real competition in home loans. Macquarie is quickly gain market share, which threatens both the earnings and dividends of the major banks in the years ahead.

Investment strategies

AI economic scenarios: revolutionary growth, or recessionary bubble?

Investor focus is turning increasingly to AI-related risks: is it a bubble about to burst, tipping the US into recession? Or is it the onset of a third industrial revolution? And what would either scenario mean for markets?

Investment strategies

The long-term case for compounders

Cyclical stocks surge in upswings but falter in downturns. Compounders - reliable, scalable, resilient businesses - offer smoother, superior returns over the full investment cycle for patient investors.

Property

AREITs are not as passive as you may think

A-REITs are often viewed as passive rental vehicles, but today’s index tells a different story. Development and funds management now dominate earnings, materially increasing volatility and risk for the sector.

Australia’s quiet dairy boom — and the investment opportunity

Dairy farming offers real asset exposure, steady income and long-term growth, yet remains overlooked by investors seeking diversification beyond traditional asset classes.

Sponsors

Alliances

© 2026 Morningstar, Inc. All rights reserved.

Disclaimer
The data, research and opinions provided here are for information purposes; are not an offer to buy or sell a security; and are not warranted to be correct, complete or accurate. Morningstar, its affiliates, and third-party content providers are not responsible for any investment decisions, damages or losses resulting from, or related to, the data and analyses or their use. To the extent any content is general advice, it has been prepared for clients of Morningstar Australasia Pty Ltd (ABN: 95 090 665 544, AFSL: 240892), without reference to your financial objectives, situation or needs. For more information refer to our Financial Services Guide. You should consider the advice in light of these matters and if applicable, the relevant Product Disclosure Statement before making any decision to invest. Past performance does not necessarily indicate a financial product’s future performance. To obtain advice tailored to your situation, contact a professional financial adviser. Articles are current as at date of publication.
This website contains information and opinions provided by third parties. Inclusion of this information does not necessarily represent Morningstar’s positions, strategies or opinions and should not be considered an endorsement by Morningstar.