Music historian and cultural critic, Ted Gioia, is one of my favourite current reads. He’s on a mission to expose the degradation of aesthetics and design in modern things and his latest target is Tesla’s Cybertruck.
He calls it “depressingly ugly” and “looks like it was designed by a third grader with a pen and ruler—who spent about three minutes drawing straight lines on the back of a homework assignment.”
Harsh? You be the judge.

Alexander-93, CC BY-SA 4.0, via Wikimedia Commons
Gioia says that while straight lines dominate the Cybertruck, they didn’t in the great cars of yesteryear, which mixed the straight with curves to create pleasing designs.

Source: Ted Giola
Gioia laments that it’s a bigger problem than just the Cybertruck, with beauty lacking in everything from household appliances to sewer covers.
And he includes a quote from Antoni Gaudi, the visionary designer of the Sagrada Familia church in Barcelona:
“The straight line belongs to men, the curved one to God.”
The art, then, is in the curves.
America eats the world
While a crude comparison, Gaudi’s quote reminds me of investor Howard Marks’ differentiation between first- and second-level thinking:
“First-level thinking is simplistic and superficial, and just about everyone can do it (a bad sign for anything involving an attempt at superiority). All the first-level thinker needs is an opinion about the future, as in “The outlook for the company is favorable, meaning the stock will go up.” Second-level thinking is deep, complex and convoluted.”
Second-level thinking for investing is what curves are for design. It’s looking beyond the obvious to the more nuanced and detailed solutions to a problem.
This has relevance to today’s markets. First-level thinking sees American dominance of global stock markets and believes that under Trump, that should continue.
After all, US markets are smashing through record highs and they’re now an unprecedented 66% of the world equity index.
MSCI AC World Index – country composition
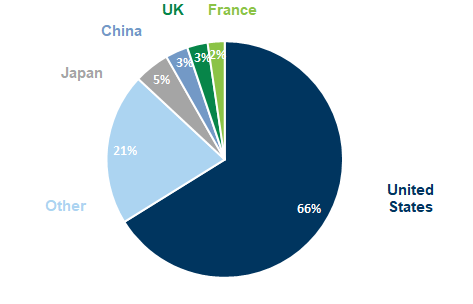
Source: Goldman Sachs
The chart is something to behold. The US is 13x larger than the next biggest weighting in Japan. It’s worth noting also that technology is about 45% of the S&P 500, if you include stocks that aren’t categorized as tech but mostly certainly are ie. Netflix, Amazon, Tesla and so on. That means US tech is about 30% of the world equity index. So, for anyone with an international stock ETF, congratulations, you are officially a concentrated investor.
It follows an extraordinary run for US stocks, not only this year but since the 2008 financial crisis.
Undoubtedly, the US has incredible momentum and the latest ETF trading reflects that. Since Trump was elected, about US$12 billion has flowed into US ETFs each day, compared to the normal US$3-4 billion. This year, ETF inflows will smash records in the US, possibly reaching US$1 trillion.
In Australia, too, money has been pouring into international equity ETFs (which should really be renamed, mainly US equities with a splash of other countries). In October, A$3.2 billion flowed into ETFs, of which half went into international stocks.
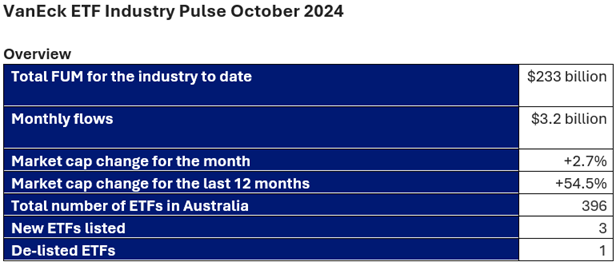
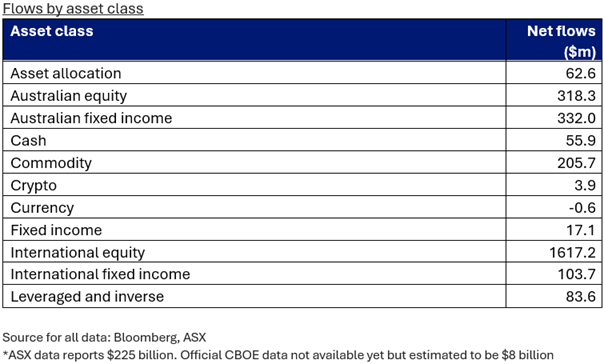
Source: VanEck
The question is whether the momentum in US stocks can continue. Since Trump’s election, there have been a million and one articles on what it means for US markets and most are bullish on what comes next for stocks.
The odd bear has poked their head up and pointed to things such as the market concentration in US large cap tech stocks and how that concentration is unusual, thereby intimating that it can’t continue indefinitely.
The bears also point to history showing one country’s dominance of world equities doesn’t last over the long term. Mean reversion seems inevitable, they believe.
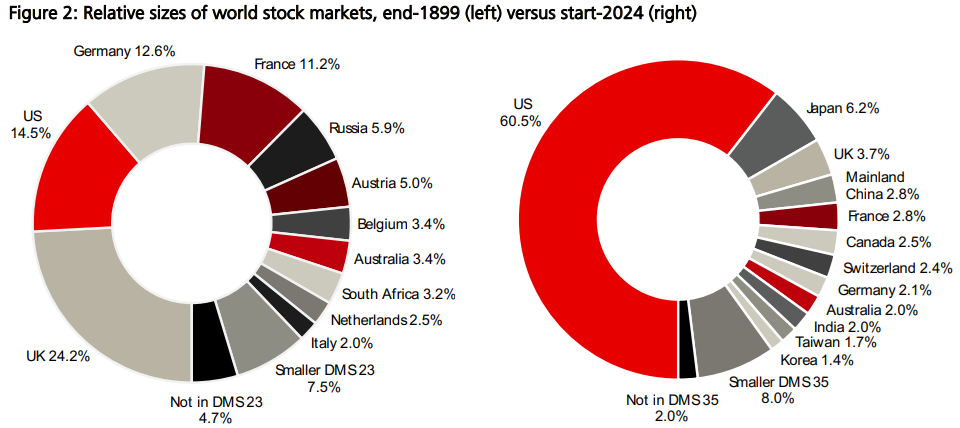
Source: UBS Global Returns Handbook 2024
In my view, both the bull and bear narratives, while seemingly simple and compelling, suffer from the first-level thinking outlined by Howard Marks.
The feedback loop driving markets
Deeper questions remain. How have US markets gotten so large? How have the Magnificent Seven tech stocks (Nvidia, Apple, Microsoft, Amazon, Tesla, Meta, Alphabet) grown to US$17 trillion in market value, about 10x the size of the Australian economy? What’s happened to the other countries which have lagged so badly?
Let’s dig into the first two of those questions. Broadly, the US emerged as the world’s sole superpower after World War Two when most other nations were on their knees. The growth from a relatively immature US economy into a more mature one has been impressive and enabled it to hold off emerging competitors through time, including Japan and China.
The rise of the Internet in the 1990s and Silicon Valley’s central role in it, has turbocharged America’s economy and markets. We’ve gone from barely any Internet users to 5.5 billion now, around 68% of the world’s population.
It’s fuelled the rise of mobile phones, software as a service, cloud computing, electronic gaming, virtual reality, and now, artificial intelligence (AI).
Stepping back, it isn’t hard to see how this has happened. Sure, exponential increases in computing power have enabled the Internet’s evolution. But it’s the demand side that interests me.
If we look at our own lives or those of our kids, most of it is spent online these days. For both work and play. We are locked into a tech orbit to such an extent that our worlds are predominately ‘virtual’ (on the net) rather than ‘reality’ (interreacting in the real world).
Our tech consumption is feeding the spending and data that powers the profits of the tech giants.
So while investors can question the valuations of the tech stocks, they can’t question the extraordinary earnings that these companies are producing.
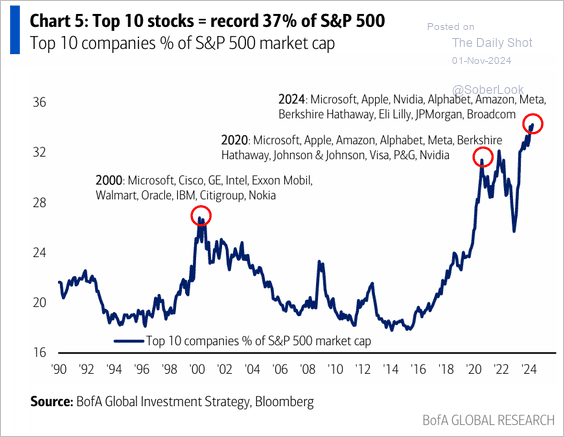
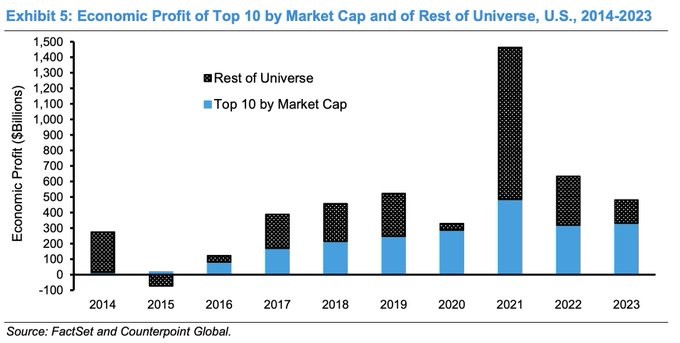
As strategist Michael Mauboussin points out, from 2014 to 2023, the top 10 stocks were 19% of the market capitalization of the S&P 500 on average while the companies made up 47% of the total economic profit (return on invested capital minus weighted average cost of capital). In 2023, the top 10 equities were 27% of the market capitalization and the firms contributed 69% to the total economic profit.
Our tech habits are driving the record net margins of tech giants, which are driving their record profits, which are driving increasing stock prices, which are driving more money into ETFs, which are driving rising market concentration in indices, which are driving share prices even higher.
It’s a seemingly virtuous feedback loop.
The capital light question
What could stop this virtuous loop? Perhaps it could be Trump and his policies, though it’s hard to envisage him implementing things that will harm the US economy and stock market. Or maybe it could be extended stock valuations and the potential for a market correction. The issue is that if profits hold up, any correction may prove short-lived.
That gives a clue, though, for what could really hurt the US market and its tech stocks: pressure on earnings and returns on capital.
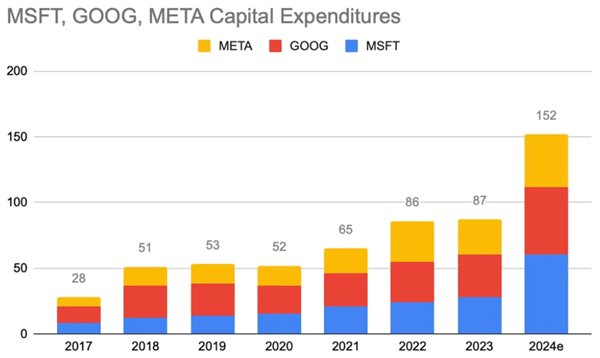
On this, fund manager John Huber has provided some great insights. He suggests that the massive ramp up in AI spending from the tech giants means that they’re turning from capital light businesses into capital heavy ones.
This year, Microsoft, Alphabet and Meta are spending US$152 billion, more than 5x what they did just seven years ago.
Source: John Huber
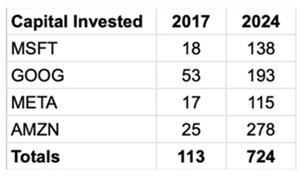
On another metric, these three companies plus Amazon had capital invested (equity plus debt) of US$113 billion in 2017, and that’s estimated to increase to US$724 billion this year.
Source: John Huber
It’s easier to make good returns on smaller amounts of money than on larger ones. At US$724 billion in invested capital, Huber thinks returns are likely to prove much harder to come by.
That said, the returns have been still impressive to date.
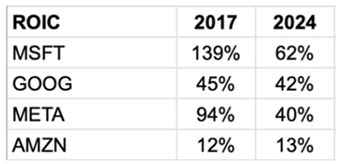
Source: John Huber
Yet, the tech behemoths are forecast to plough even more money into AI in coming years. Even if capital expenditures remain at 2024 levels, that’s US$750 billion over the next five years. AI will have to generate incredible returns to justify the spend.
Even still, the attractiveness of the tech companies has been their capital light models, and that’s clearly changing going forward. In Huber’s eyes, that could hurt returns and valuations, and I think he has a point.
This type of thinking looks beyond market noise to a more nuanced evaluation of the future. Looking less at the straight lines and more at the curves, as Ted Gioia might say.
James Gruber is editor of Firstlinks and Morningstar.