Register For Our Mailing List

Register to receive our free weekly newsletter including editorials.

Home / 186

Are we going through a 'bond market rout'?

The second half of 2016 is shaping up as one of the more negative half years for bond returns on record, especially at the long end of the yield curve.  It’s not uncommon for financial press articles to refer to what’s happening to government bonds as a 'rout', but is it really that bad?

The focus of this article is the US Treasury market, bond yields, and what that means for bond returns.

Since early July 2016, when 10-year Treasury yields traded at an all-time low of 1.36%, the trend has been higher. It was a steady burn for a few months, but the speed of the increase has picked up since early November. This was around the time financial markets started to price in a Trump victory, a few days out from the vote.

As of 9 December, an investor could purchase a 10-year Treasury to yield 2.47%. Of the 1.11% increase over the past five months, around 2/3 has happened over the past four weeks, and an increase of 0.77% over a month is a very sharp move by historical standards; not unprecedented, but far from common.

The following chart shows the history of the 10-year US bond yield since the all-time peak back in 1983. Since then, there have been 10 prior periods (shown by the arrows) where the yield has increased by at least 0.9% over around 5-6 months.

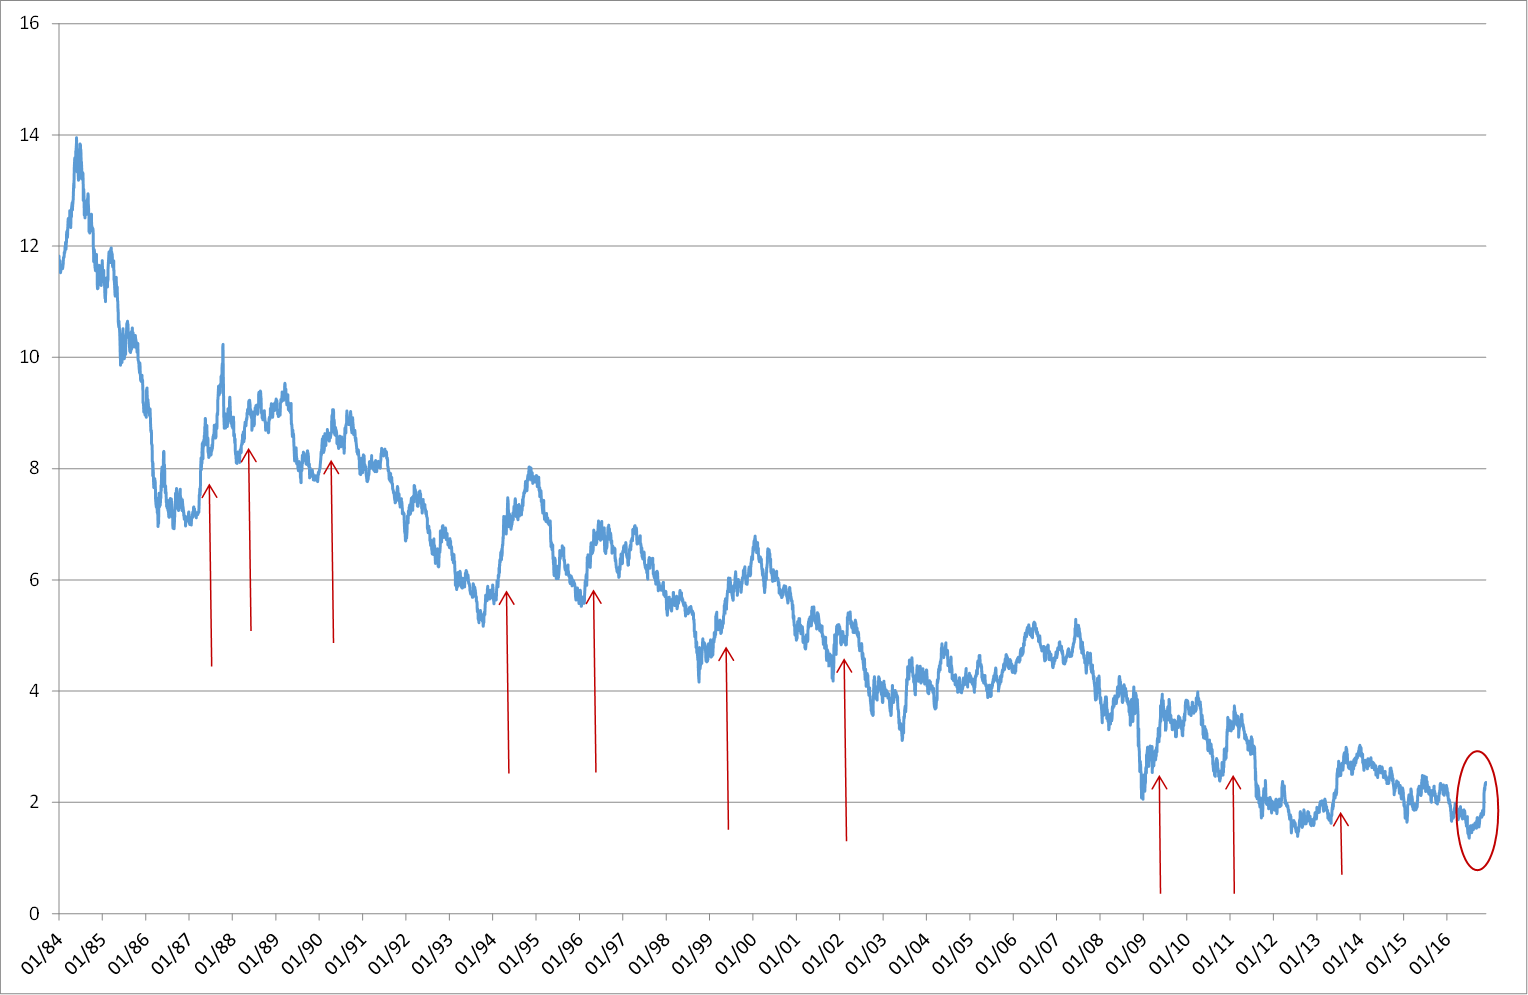
In other words, history tells us we can expect a long bond yield rise of the magnitude we’ve seen in 2016 on average once every three years.

Of course, this rising trend may not yet be over. The 1.11% rise posted so far could turn into more, so what does history tell us in this regard?

History repeats, but how often?

Not surprisingly, history does not provide much clarity. Even if there were a regular pattern, a sample size of 10 is nowhere near enough to draw firm conclusions. However, there isn’t a regular pattern. Half of the previous 10 occurrences of at least 0.9% increases petered out around this level. If those histories are repeated, then this ‘rout’ is just about done and dusted.

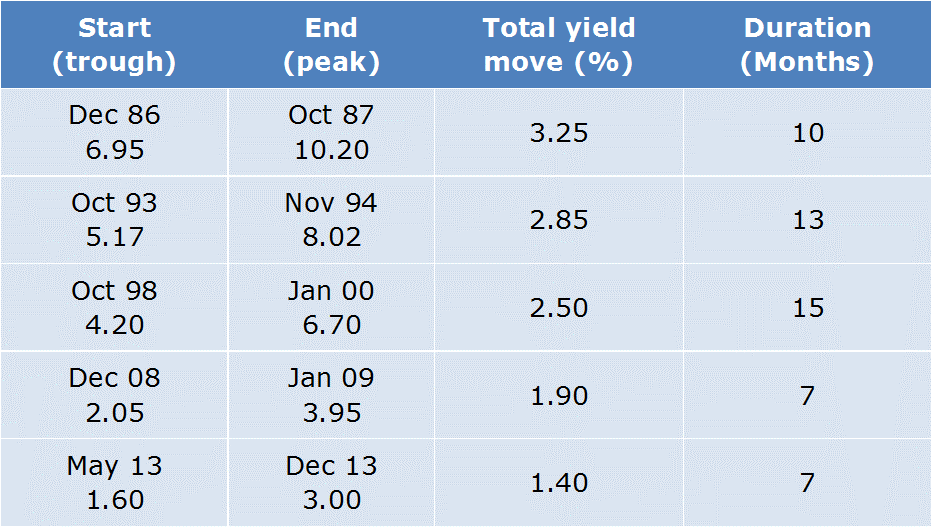
The other half, however, continued for varying lengths and to varying degrees. If these histories were to repeat, then there’s a way to go yet before we reach the peak in this cycle for US yields. The following table summarises those episodes.

The impact on bond prices and bond returns

Of course, when bond yields rise, bond prices fall, at least initially (every bond matures at par, whatever happens today or tomorrow). When the time period over which this happens is short enough, total bond returns can become negative as well.

The recent yield increase translates into a decline in the capital value of the 10-year Treasury bond since early July of 10.0%. Here we have a living, breathing instance of the usual example that’s used to explain what 'modified duration' means. That is, if you get a yield move of 1% you multiply the duration to get the price change. In this case the yield move was a little bit more than 1%, but with the modified duration of the current 10-year bond at around 9.2 years, the maths follows.

Adding back the interest that’s been paid and accrued, the total return on the bond over the past five months has been -9.4%.

To compare this with history, it’s easier to use data for a bond index, such as the Bank of America Merrill Lynch 10-15 year Treasury index. The total return on this index over the past five months has been -8.6%. This ranks as the third worst return over a similar period in the past three decades. It was outdone only by 2013’s ‘taper tantrum’ of -9.9% and the -9.1% from the yield rebound in 2009 that followed the Lehman collapse.

The reason a yield move that has already occurred 10 times has resulted in a total return among the worst few in history is mostly because of the starting yield. When 10-year bonds have risen by about 1% in the past, they’ve been paying 4%, 6% or higher interest returns. That provided a larger positive contribution to the total return over any five-month period than July 2016’s 1.4% yield. Low yields also mean longer bond duration, which magnifies the impact of a given yield change. For instance, in a 6% yield environment, the 10-year bond’s duration would have been around 7.5 years instead of more than nine years. So a 1% yield change today means an additional 1.5% in capital value adjustment.

What does this mean for Australian bond investors?

Most Australians hold a portfolio that is more of a composite of domestic government, semi-government and corporate bonds. Their portfolio at July’s low point was yielding 2% and has seen an increase to around 2.6%. That’s a much more moderate change than has taken place in the 10-year Treasury market. Also, the local market has a significantly shorter duration of about 5.3 years. Therefore, broad Australian bond market indexes over the past five months have returned a much more moderate -3% or thereabouts.

Furthermore, the one-year returns for 2016 will be positive. The broad market index seems likely to come in at around +3%, so still above cash. This is because the sell-off in the second half of 2016 followed a rally in the first half of the year.

End of the bull market?

What we’ve witnessed over the past few months could well mark the end of the so-called '30-year bull market in bonds'. The possibility that yields will continue to trend higher, back to pre-GFC levels where 10-year Treasuries paid investors 4% or more, is not objectionable. It would be fantastic if that happened, because it would mean that world economic fundamentals had healed, after being so badly damaged in the last decade or so. It would mean that bond markets were experiencing rising returns – short term capital pain, yes, but rising reinvestment into a higher-yielding environment that will produce better long-term outcomes than the low yields we’ve seen during 2016.

However, it’s still far too early to call the end of the 'lower-for-longer' scenario. Just because bond yields have risen from their all-time lows doesn’t mean they’ve broken out of the historically low trading ranges of the past few years. They might do that, but they haven’t yet.


Warren Bird is Executive Director of Uniting Financial Services, a division of the Uniting Church (NSW & ACT). He has 30 years’ experience in fixed income investing. He also serves as an Independent Member of the GESB Investment Committee.


7 Comments
Warren Bird
June 14, 2022

OK, I guess it's time for an update. I could now clearly add a new row to the table in the article of significant periods of rising yields (aka "bear markets"). I might be a few basis points out given the data I now rely upon, but over the last 2 years, since July 2020, US 10 year yields have risen from 0.55% to 3.43%. That's 2.88% over 23 months. So in yield change terms, it's up there with 1994 - a tiny bit worse at this stage in fact - but it's played out over quite a bit longer period. Total returns over this period have been much lower than in 1994, however, given the lack of yield to maturity at the start of the current bear market. We're looking at negative returns over the 2 year period for the typical Australian bond fund of 10-15%, with the more recent 12 months within that two years contributing more than half of that outcome. 1994 wasn't quite as bad and it was only the one year before returns recovered due both to high starting yields (over 10% in Australia) and a peak in the yield cycle. (That was, as it turned out, the last opportunity to buy Australian government bonds at double digit yield. Not many fund managers took that chance, but I'm happy to say that the funds I had control of at the time did move quite a bit from cash to bonds at the time.) It's not necessarily over yet, of course, so the record bear market move in the US of 3.25% in 1987 is well within reach and could easily be exceeded. The lunacy of central banks ignoring how their QE had turned into money supply growth in 2020-21, resulting in them not acting to contain inflation a year ago when it was obvious that it was going to be an issue, means that even at 3.4%, the US 10 year Treasury bond is paying a big negative real yield at the moment. But it's not as negative as cash, so I expect that the big end of town will start to nibble at buying bonds and lengthening duration from here. Cautiously, I suspect, but if the central banks do start acting to reign in their monetary policy accommodation and get us back to a more slow and steady with inflation, then from a longer term perspective yields are just about at 'fair value' levels.

Warren Bird
April 18, 2023

Perhaps the final update on this. It seems that US 10 year bond rates peaked for this cycle at just over 4.2% in October 2022. So the 2021-22 bear market ended up being about 3.7% over 27 months, both the largest in yield moves and the longest in months. With the starting yield point so low, the annual average negative return over 2.25 years was about 7.5%-8.0% for the US Treasury and Australian composite bond indices.

I have to admit that one of my comments in the original article hasn't actually played out as well as I'd hoped/expected. When I said that a return to a 4% long term bond yield would be because the world economy had healed and we were getting back to a more normal fundamental situation, I hadn't counted on central banks losing the plot on inflation, allowing it to take off the way it has, and then having to catch up with aggressive monetary policy moves. That is not part of a healed economy! We got back to 4% with much pain and the risk of a severe recession ahead of us. From the decades long 'no cycle cycle' period where inflation was fairly steady and monetary policy mostly contributed to macroeconomic stability, we've entered a period of instability triggered by policy instability. Monetary policy was too easy for too long and it's now at risk of being tightened too much. That's a great shame and has undermined the credibility of central banks the world over. It's hard to see this playing out very well.

Warren Bird
March 08, 2021

Ah, it's happening again, with articles like today's AFR piece on the 'bloodbath' we're supposedly experiencing now. The article is about Australian long bonds, which have risen a bit further than in the US and a little more sharply than over there, but to update the data in this article what we've seen (so far) is a 7 month 'bear market' in which 10 year Treasury yields have risen by 1%, from 0.55 to 1.55 since last August. That's mild by comparison with the 1999, 2008-09 and 2013 bear markets which were of similar duration.
This one could go on a bit longer, of course, but it's far too early in my view to be looking at the current market as anything other than just a normal period of cyclical change in bond yields.

Warren Bird
January 13, 2020

I think we can now definitively say that the 'bear market' that started in July 2013 ended a little while ago, in October 2018. 


Thus we can update the table in the article, changing the bottom line to show a total yield increase from trough to peak of 1.65% and the time period for this move at 27 months.

So, the mildest 'bear market' in US Treasuries ever and it took a relative eternity to play out. Like I said in the article, this was not a rout!

We can say that the period of rising yields ended October 2018 because they've since fallen below 2% again.

Warren Bird
January 31, 2018

With many articles in the last week or so seeking to get everyone excited or worried or panicky about the latest move up in US (and global) government bond yields, I'm reminded of this article which I wrote just over a year ago.

Although since then yields initially fell (as noted in the comments above) and are now on the rise again, you could consider the current move to be a continuation of the shift to higher yields that started in July 2016. If you look at it that way, then this is the longest period of bear market in the history covered in the paper (back to 1983), at 19 months. But it is also the mildest (so far) with a total net move up of under 140 bps. The total return over this 19 month period from the BoAML US Treasury Master is pretty modest, at -3.6%.

Analyst and media commentator hype is now focusing on how the yield has now broken to its highest in 4 years and that sort of thing. So what? The long run trend (since 1983) to lower nominal yields ended back in 2012. Since then 10 year Treasuries have traded in a range from around 1.4% to 3.0%. We're still in that range.

My concluding paragraphs from Dec 2016 therefore still stand. We may be a little closer to seeing a higher risk free return on capital from a healthier world economy, and with it a higher long term rate. But for me that's a reason to celebrate, not a reason for concern.

Warren Bird
April 13, 2017

Update: US 10 year Treasuries last night traded down to a yield of 2.24%. Since the sharp rise post-election, the market had traded in a 2.30-2.60% range. So last night represents a break out from that range, on the side of lower yields.

Yet again those who want to get bearish on the bond market are being thwarted by the reality that the risk free return on assets in the global economy continues to be very low. Just when you think it's safe to start backing risk again, the economy falters or global tensions erupt and we are reminded of the threats that financial assets actually face.

I continue to wish it weren't so and that the world could sustain a move to higher interest rates. Just don't think we're quite there yet.

Warren Bird
December 21, 2016

Looks like the RBA Board came to a similar conclusion, though if they'd held the meeting a week or so later (the time I wrote this article) they might have been a little more alert to the possibility that this current move could turn into one of the larger moves seen in recent decades. Quote from the minutes of the December meeting released yesterday:

Members observed that the increase in US Treasury yields, while large, was not as large as some other movements in recent decades and yields remained very low by historical standards.


Leave a Comment:

RELATED ARTICLES

Bond basics and four messages in the search for yield

Are you in fixed interest for the duration?

banner

Most viewed in recent weeks

2024/25 super thresholds – key changes and implications

The ATO has released all the superannuation rates and thresholds that will apply from 1 July 2024. Here's what’s changing and what’s not, and some key considerations and opportunities in the lead up to 30 June and beyond.

Five months on from cancer diagnosis

Life has radically shifted with my brain cancer, and I don’t know if it will ever be the same again. After decades of writing and a dozen years with Firstlinks, I still want to contribute, but exactly how and when I do that is unclear.

Is Australia ready for its population growth over the next decade?

Australia will have 3.7 million more people in a decade's time, though the growth won't be evenly distributed. Over 85s will see the fastest growth, while the number of younger people will barely rise. 

Welcome to Firstlinks Edition 552 with weekend update

Being rich is having a high-paying job and accumulating fancy houses and cars, while being wealthy is owning assets that provide passive income, as well as freedom and flexibility. Knowing the difference can reframe your life.

  • 21 March 2024

Why LICs may be close to bottoming

Investor disgust, consolidation, de-listings, price discounts, activist investors entering - it’s what typically happens at business cycle troughs, and it’s happening to LICs now. That may present a potential opportunity.

The public servants demanding $3m super tax exemption

The $3 million super tax will capture retired, and soon to retire, public servants and politicians who are members of defined benefit superannuation schemes. Lobbying efforts for exemptions to the tax are intensifying.

Latest Updates

Retirement

Uncomfortable truths: The real cost of living in retirement

How useful are the retirement savings and spending targets put out by various groups such as ASFA? Not very, and it's reducing the ability of ordinary retirees to fully understand their retirement income options.

Shares

On the virtue of owning wonderful businesses like CBA

The US market has pummelled Australia's over the past 16 years and for good reason: it has some incredible businesses. Australia does too, but if you want to enjoy US-type returns, you need to know where to look.

Investment strategies

Why bank hybrids are being priced at a premium

As long as the banks have no desire to pay up for term deposit funding - which looks likely for a while yet - investors will continue to pay a premium for the higher yielding, but riskier hybrid instrument.

Investment strategies

The Magnificent Seven's dominance poses ever-growing risks

The rise of the Magnificent Seven and their large weighting in US indices has led to debate about concentration risk in markets. Whatever your view, the crowding into these stocks poses several challenges for global investors.

Strategy

Wealth is more than a number

Money can bolster our joy in real ways. However, if we relentlessly chase wealth at the expense of other facets of well-being, history and science both teach us that it will lead to a hollowing out of life.

The copper bull market may have years to run

The copper market is barrelling towards a significant deficit and price surge over the next few decades that investors should not discount when looking at the potential for artificial intelligence and renewable energy.

Property

Global REITs are on sale

Global REITs have been out of favour for some time. While office remains a concern, the rest of the sector is in good shape and offers compelling value, with many REITs trading below underlying asset replacement costs.

Sponsors

Alliances

© 2024 Morningstar, Inc. All rights reserved.

Disclaimer
The data, research and opinions provided here are for information purposes; are not an offer to buy or sell a security; and are not warranted to be correct, complete or accurate. Morningstar, its affiliates, and third-party content providers are not responsible for any investment decisions, damages or losses resulting from, or related to, the data and analyses or their use. To the extent any content is general advice, it has been prepared for clients of Morningstar Australasia Pty Ltd (ABN: 95 090 665 544, AFSL: 240892), without reference to your financial objectives, situation or needs. For more information refer to our Financial Services Guide. You should consider the advice in light of these matters and if applicable, the relevant Product Disclosure Statement before making any decision to invest. Past performance does not necessarily indicate a financial product’s future performance. To obtain advice tailored to your situation, contact a professional financial adviser. Articles are current as at date of publication.
This website contains information and opinions provided by third parties. Inclusion of this information does not necessarily represent Morningstar’s positions, strategies or opinions and should not be considered an endorsement by Morningstar.