Register For Our Mailing List

Register to receive our free weekly newsletter including editorials.

Home / 317

Did your super do better than this in FY19?

Most Australians hold their superannuation in funds selected by their employer. Although the default process faces criticisms and members are generally disengaged, it produces excellent results.

For the first time ever, according to Chant West, institutional super funds delivered a 10th consecutive positive financial year return, with the median growth fund up 7% last financial year. Growth funds have a 61% to 80% allocation to growth assets, although there is some debate about the accuracy of this categorisation. The average return over 10 years has been a healthy 8.8% pa. The funds are unlikely to achieve anywhere near that level in the next decade.

No one way to produce the best results

Surprisingly, the top two funds over one year, QSuper and UniSuper, manage vastly different portfolios, and they are both in the top few over a more meaningful 10 years, as shown below. Chant West’s Senior Investment Manager, Mano Mohankumar, said:

“QSuper, like most not-for profit funds, has a meaningful allocation to unlisted assets such as property, infrastructure and private equity. However, where its strategy is unique is that it further smooths out returns for members by investing significantly less in listed shares than other funds. Against that, it maintains a significant allocation to long duration bonds which carry sharemarket-like risk but are a better diversifier against sharemarket falls than traditional bonds.

UniSuper, in contrast, has a strong focus on listed assets. Unlike most other not-for-profit funds, it has very little invested in unlisted assets. Instead, it prefers to gain its exposure to property and infrastructure by taking large stakes in high quality listed companies. UniSuper believes that taking this listed market route has enabled it to be opportunistic in building a portfolio of higher quality property and infrastructure assets at attractive prices.”

It is estimated that 93% of Unisuper’s assets are listed securities available to anybody. How did your portfolio perform relative to these large funds? (results are net of investment management fees).

Top 10 performing growth funds, one year to 30 June 2019 (%)
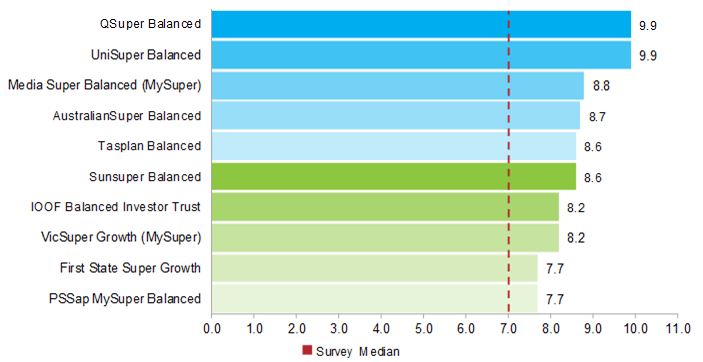
Source: Chant West, red line is survey median.

Top 10 performing growth funds, 10 years to 30 June 2019 (%)
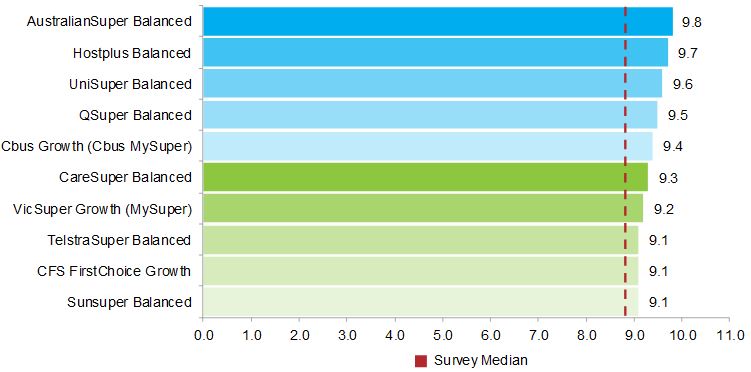
Source: Chant West, red line is survey median.

The table below shows performance by fund category. While 2% makes a material difference in a superannuation balance over 15 years, the ‘All Growth’ fund long-term return of 7.8% is only 2% higher than the conservative fund, although the latter’s result is aided significantly by falling bond yields.

Diversified fund performance to 30 June 2019
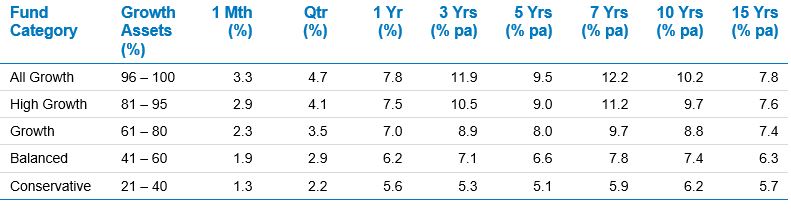
Source: Chant West.

In the last 27 years, as shown below, growth funds have delivered negative returns in only three years including the two years of the GFC. The last decade has been wonderful for super fund members, and the long period of strong returns suggests growth rather than defensive is worthwhile over multi-decade investment horizons.
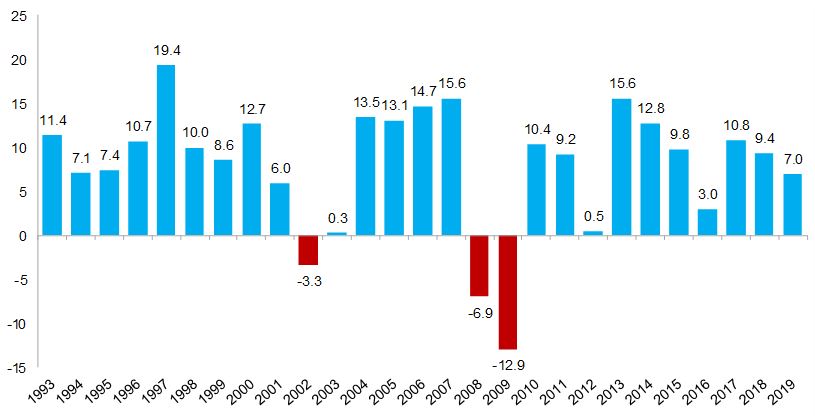
Source: Chant West.

Australian shares managed funds results

Turning to managed fund results as reported by Mercer, the table below compares the Top 10 in Australian shares (ranked according to their one-year results) out to 5 year performance. It is evidence that fund managers should not be judged on short-term numbers. For example, the top fund over one year, the Martin Currie Australian Real Income Fund, was 108th out of 142 over 3 months and 99th out of 121 over 3 years. But its 5 year number was also strong.
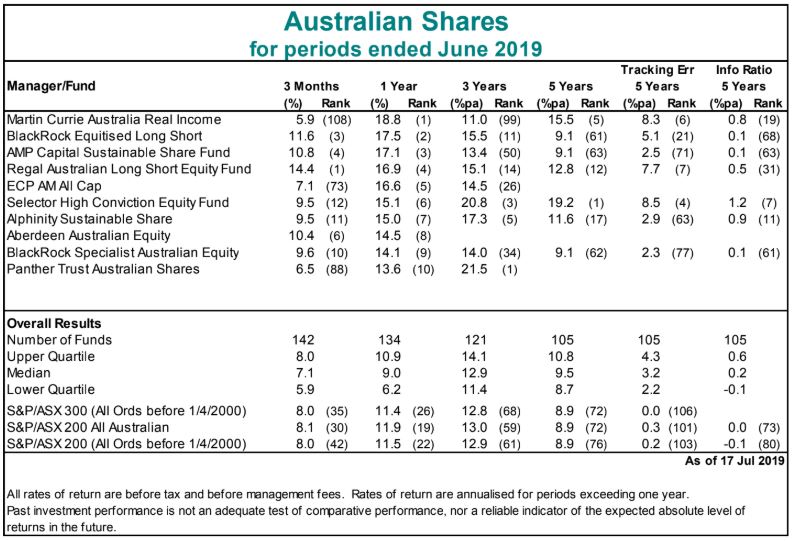
The table also shows:

  • In the last year, the median manager (up 9%) has significantly underperformed the S&P/ASX300 index (up 11.4%) but they were much closer over 5 years with the median at 9.5% and the index at 8.9%. However, the results are before management fees so the median manager would struggle to match the index.
  • Although a challenge for any investor, picking the top fund manager versus the bottom produces a major result difference. For example, the top fund over 5 years was Selector High Conviction Equity Fund at 19.2% while the bottom quartile delivered only 8.7%. With each quartile holding 26 managers in the 5 year numbers, that’s a lot of talented fund managers delivering poor long-term results.


Graham Hand is Managing Editor of Cuffelinks. This article is general information and does not consider the circumstances of any investor.


  •   31 July 2019
  • 13
  •      
  •   
13 Comments
Steve
August 04, 2019

It is interesting to note that all of those fund members who rolled all of their super funds into HostPlus last year, simply because financial journalists & book authors sang their praises as Super fund of the year, only to discover that HostPlus didn’t even make it into the Top 10 funds for 2019.

Of course, no Statements of Advice were supplied to these fund members explaining why it was in their best interest to do so. It’s a good business selling books to the masses.

karen staniforth
August 04, 2019

Why do we never see performance figures for GESB Weststate/GESB Superannuation products? I would like to know how GESB is rated amongst other Superannuation Funds. Thankyou

Steve
August 04, 2019

You can find their results at their website (if you look right now). You will discover that their returns were modest for the past 12 months.

Joel
August 04, 2019

What I find interesting is that all of the funds in these “best of” league tables still underperform the growth (i.e. 70%) multi-sector index! This is despite them having more than 70% growth as well (QSuper possibly excepted) over these periods. Even if you take a multi-sector index fund which is net of fees (which are low), there is still underperformance.

Everyone is battling it out to second best. It will be interesting to see if indexing continues to outperform over the next 10 years.

Graeme B
August 04, 2019

Not a lot of us who didn’t beat the market are going to respond I suppose. It is probably vulgar to talk money but if I can shout or whisper I believe I did. Admittedly by taking a higher level of risk than the fundies could get away with.

Bill
August 04, 2019

Interesting how some of these ‘balanced’ industry funds hold up to 70-80% growth assets.

I wonder if members are aware of the higher underlying risks contrary to what the ‘balanced’ option implies?…. ‘Only when the tide goes out do you discover who’s been swimming naked.’

Joel
August 04, 2019

Some of the funds in the top 10 hold 90% growth assets, but this is depends on your definition of “growth”. Let’s just say that to call them “defensive” instead might be misleading.

SB
August 04, 2019

Yes, mine is invested in only aust shares and cash and returned 66% in FY19.

raymond
August 04, 2019

just to answer the question in the headline: yes. My SMSF increased 14% last financial year and 17% the year before. And that’s after brokerage, auditing, life insurance and all the other unnecessary costs that we are burdened with.

Graham Hand
August 04, 2019

Hi Hamish, a few points. Average returns for the last 10 years for ‘growth’ funds with 61 to 80% allocated to growth assets:

1. The bond allocation has done well with falling interest rates. With cash at 1% and 10 year bonds at 1.25%, how much further can they fall to generate capital gains (or income).

2. Equity markets at all-time highs a decade after the 2008-2008 GFC.

3. Valuations are high and while these levels do not tell you when the market will fall, they do indicate future returns will be lower.

I’d say 5% over the next decade will be a good result.

Hamish
August 04, 2019

Thanks for your article. Can you please elaborate on your comment in the second paragraph… “The funds are unlikely to achieve anywhere near that level in the next decade.”
Thanks

Geoff
August 09, 2019

Why did the CFS Wholesale Diversified fund not make the list? Their website is showing a return of 8.71% for the 12 months to June.

Warren
August 11, 2019

Karen, GESB aims to provide on its website all the information that a member needs to evaluate the range of investment options that are offered. GESB doesn’t subscribe to Chant West, so doesn’t appear in their performance tables.

Although the Board and Investment Committee (on which I sit) isn’t all that interested in short term peer comparisons, I can’t let Steve’s throwaway remark stand. “Modest” is a subjective term, so let me share some facts.

The GESB Super Growth Plan over 2018-19 year returned 7.5% after fees – which would place it above median, but just outside the top 10 in the chart. Over the 10 years the net return was 9.5% per annum, which would place GESB in the top 10.

As a member of GESB’s investment committee, I’m reasonably satisfied with those numbers, but not because they seem to line up well in an arbitrarily defined category in a table of several superfunds. Rather, it’s because they deliver solidly against the return objectives that we indicate to members we’re seeking to provide.

Returns data across the range of funds can be found here: https://www.gesb.wa.gov.au/members/investment-and-performance/performance/investment-returns/gesb-super


Leave a Comment:

RELATED ARTICLES

Death benefits from super don't need to be this complicated

Extending performance tests to retirement super is a bad idea

Are mega super funds’ returns set to fall?

banner

Most viewed in recent weeks

It’s time for LICs to die

A high-profile dividend cut and a prominent fund manager’s apology have reignited a long-running debate. If investors can access similar exposures more cheaply and efficiently elsewhere, what exactly is keeping LICs alive?

Testamentary trusts survived the trust tax. The drafting battle has just begun.

The fight over testamentary trusts looked settled. Then the draft legislation arrived. Hidden in a technical detail is a question that could force many families to rethink wills they thought were already future-proof.

The new capital gains tax trap for your portfolio

Investors have long accepted one portfolio rule without much question. A major tax shift could change that calculation entirely, forcing difficult trade-offs between risk, discipline and an overlooked cost lurking beneath.

The retirement scorecard: how many of these questions can you answer?

From the maths of retirement, estimating spending and picking the right asset allocation to survive a poor decade, here are the questions every retiree – current or future – should be able to answer for themselves.

How the typical Australian Family could save $844,350 in taxes

The value of a testamentary trust is not determined by wealth alone. Depending on circumstances, it can reduce the tax burden on inherited income, create efficiencies and help build intergenerational wealth.

The housing slide could become a crash

House prices are sliding across Australia, yet the most dangerous ingredient for a housing crash is still missing. If job losses surge amid growing economic risks, today's correction could become a historic property downturn.

Latest Updates

Testamentary trusts: Treasury has picked the wrong reading

A decades-old estate planning tool has survived one tax crackdown only to be caught by another. The surprise isn't who the reform is targeting, but who could end up paying the price for drafting choices made years ago.

Latest from Morningstar

Does an American retirement rule work for Australians?

The 4% rule has survived decades of scrutiny, but Australia's retirement system changes the equation in ways most overlook. Before accepting or rejecting this rule of thumb, it pays to understand what really drives retirement outcomes.

Shares

Glencore lands on the ASX. Should BHP and Rio shareholders switch?

A coal-heavy miner with governance concerns isn't the obvious choice for investors. Yet, Glencore's ASX listing may offer something BHP and Rio can't. The challenge is working out whether the opportunity outweighs the risks.

Why does the system treat capital gains and losses differently?

Investors are often told not to let tax policy drive their investment decisions. Yet, under the new CGT rules, portfolio construction, volatility and even how assets are owned may have an outsized impact on their final outcome.

Economy

Three common sense reforms that Australia needs

What do frozen bank accounts, mortgage traps and pension penalties have in common? They're all symptoms of a system that makes life much harder. Yet the obvious solutions seem to have escaped the attention of Canberra.

Shares

The hidden cost of government debt for investors

Some of the important effects of rising public debt never make the headlines. Research shows the immediate effects may already be unfolding, influencing corporate behaviour in ways that many investors would never suspect.

Investment strategies

When do fundamentals matter?

Is fundamental investing losing its grip on markets? Investors continue to search for valuation-based explanations for every price move, but the dominant force behind short-term returns may be something else altogether.

Sponsors

Alliances

  • ASA-Logo-RGB-ActiveGreen-web.png

© 2026 Morningstar, Inc. All rights reserved.

Disclaimer
The data, research and opinions provided here are for information purposes; are not an offer to buy or sell a security; and are not warranted to be correct, complete or accurate. Morningstar, its affiliates, and third-party content providers are not responsible for any investment decisions, damages or losses resulting from, or related to, the data and analyses or their use. To the extent any content is general advice, it has been prepared for clients of Morningstar Australasia Pty Ltd (ABN: 95 090 665 544, AFSL: 240892), without reference to your financial objectives, situation or needs. For more information refer to our Financial Services Guide. You should consider the advice in light of these matters and if applicable, the relevant Product Disclosure Statement before making any decision to invest. Past performance does not necessarily indicate a financial product’s future performance. To obtain advice tailored to your situation, contact a professional financial adviser. Articles are current as at date of publication.
This website contains information and opinions provided by third parties. Inclusion of this information does not necessarily represent Morningstar’s positions, strategies or opinions and should not be considered an endorsement by Morningstar.