Register For Our Mailing List

Register to receive our free weekly newsletter including editorials.

Home / 203

Diversification captures the winning outliers

At a conceptual level, diversification is about spreading risk and not putting all our eggs in one basket. Quantitatively, as I’ve previously explained, one of the main benefits of diversification is lowering the volatility for a given level of expected return. Another way of looking at it is that diversification allows an improvement in returns for a given level of risk, either through levering up to our desired risk tolerance or by capturing positive outliers in the return distribution of stocks in the market.

A few stocks can drive the overall index

Both here and abroad, a concentration of stock returns has often driven overall market performance, in that a relatively small number of large-cap ‘winners’ can carry an entire index. One key implication is there is potentially a large opportunity cost of not holding the index or a broad market portfolio, particularly in a bull market, either through attempts at stock picking or trying to diversify using only a few stocks. By constructing a narrow portfolio using a limited number of securities, significant returns might be left on the table.

Much has been written about the underperformance of most active managers against their respective benchmarks, and one possible reason is the degree of outperformance by a relatively small number of stocks. These positive outliers may not have been held or have been held underweight by underperforming active managers, dragging down overall fund returns relative to the index.

To investigate the degree that a small number of stocks drive index performance, let’s decompose the returns in the S&P/ASX200 Total Return Index over the past few years and find out which stocks were the key drivers of index performance during broad market rallies.

S&P/ASX200 Total Return Attribution

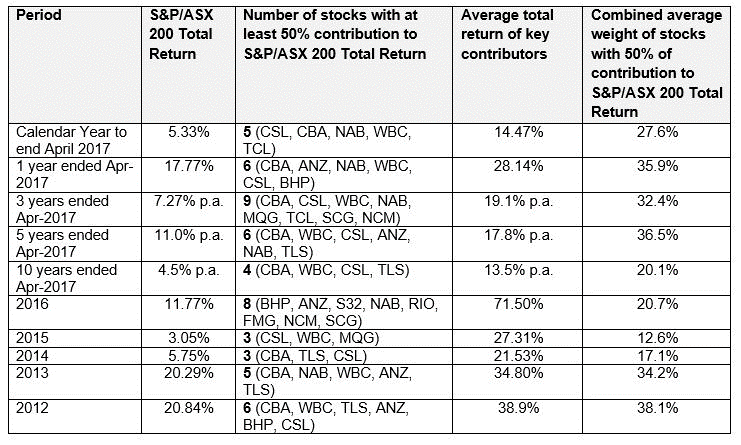
Source: Bloomberg. Total returns include reinvested dividends. Past performance is not an indication of future performance.

The table shows that in most return periods in recent years, a few large cap stocks have driven the S&P/ASX 200’s returns. For example, just 4 stocks – CBA, WBC, CSL and TLS – accounted for 51% of the index’s 55.29% total return (4.5% annualised) over the past 10 years, with the average return of just those stocks 256% over the period (13.5% annualised).

Active managers need to pick these winners

There are a number of ways of interpreting the results. One is that large index-beating return possibilities have existed by picking the right stocks in recent years. However, the risk of underperformance and likelihood of failing to include the right stocks are also large because the number of index drivers have been so few.

It would be remiss not to point out that the reverse could well happen during a bear market, where a handful of large-caps could drive the overall index lower. For example, BHP was a particularly large driver of 2011’s market correction and weighed heavily on S&P/ASX200 returns in 2014 and 2015. But assuming we’re taking a long-term view, the market tends to trend upwards over time.

Caution is also needed regarding the nature of market cap weighting, as past ‘winners’ will account for an increasingly larger index share over time, which we’ve seen for the major banks. This may increase the likelihood that yesterday’s heroes could become tomorrow’s broad market villains in a correction, due to the nature of their outsized weightings. Using an alternative weighting strategy to market cap (such as Research Affiliates’ fundamental weighting methodology) can potentially reduce this risk.

If you have a particularly strong view and have confidence in the stock picking abilities of yourself or a fund manager, you should back yourself. However, it’s worth keeping in mind that failure to pick the few stocks that drive an index’s returns could generate significant underperformance.


Chamath De Silva is an Assistant Portfolio Manager at BetaShares Capital. BetaShares is a sponsor of Cuffelinks and issues broad market ETFs such as AUST, QOZ, GEAR or WRLD. This article is general information and does not consider the circumstances of any investor.

RELATED ARTICLES

Changing times as share investors settle in for the long haul

Worried about low rates, SMSFs drop banks and diversify

Headwinds and tailwinds, a decade in review

banner

Most viewed in recent weeks

The case for the $3 million super tax

The Government's proposed tax has copped a lot of flack though I think it's a reasonable approach to improve the long-term sustainability of superannuation and the retirement income system. Here’s why.

7 examples of how the new super tax will be calculated

You've no doubt heard about Division 296. These case studies show what people at various levels above the $3 million threshold might need to pay the ATO, with examples ranging from under $500 to more than $35,000.

The revolt against Baby Boomer wealth

The $3m super tax could be put down to the Government needing money and the wealthy being easy targets. It’s deeper than that though and this looks at the factors behind the policy and why more taxes on the wealthy are coming.

Meg on SMSFs: Withdrawing assets ahead of the $3m super tax

The super tax has caused an almighty scuffle, but for SMSFs impacted by the proposed tax, a big question remains: what should they do now? Here are ideas for those wanting to withdraw money from their SMSF.

The super tax and the defined benefits scandal

Australia's superannuation inequities date back to poor decisions made by Parliament two decades ago. If super for the wealthy needs resetting, so too does the defined benefits schemes for our public servants.

Are franking credits hurting Australia’s economy?

Business investment and per capita GDP have languished over the past decade and the Labor Government is conducting inquiries to find out why. Franking credits should be part of the debate about our stalling economy.

Latest Updates

Superannuation

Here's what should replace the $3 million super tax

With Div. 296 looming, is there a smarter way to tax superannuation? This proposes a fairer, income-linked alternative that respects compounding, ensures predictability, and avoids taxing unrealised capital gains. 

Superannuation

Less than 1% of wealthy families will struggle to pay super tax: study

An ANU study has found that families with at least one super balance over $3 million have average wealth exceeding $19 million - suggesting most are well placed to absorb taxes on unrealised capital gains.   

Superannuation

Are SMSFs getting too much of a free ride?

SMSFs have managed to match, or even outperform, larger super funds despite adopting more conservative investment strategies. This looks at how they've done it - and the potential policy implications.  

Property

A developer's take on Australia's housing issues

Stockland’s development chief discusses supply constraints, government initiatives and the impact of Japanese-owned homebuilders on the industry. He also talks of green shoots in a troubled property market.

Economy

Lessons from 100 years of growing US debt

As the US debt ceiling looms, the usual warnings about a potential crash in bond and equity markets have started to appear. Investors can take confidence from history but should keep an eye on two main indicators.

Investment strategies

Investors might be paying too much for familiarity

US mega-cap tech stocks have dominated recent returns - but is familiarity distorting judgement? Like the Monty Hall problem, investing success often comes from switching when it feels hardest to do so.

Latest from Morningstar

A winning investment strategy sitting right under your nose

How does a strategy built around systematically buying-and-holding a basket of the market's biggest losers perform? It turns out pretty well, so why don't more investors do it?

Sponsors

Alliances

© 2025 Morningstar, Inc. All rights reserved.

Disclaimer
The data, research and opinions provided here are for information purposes; are not an offer to buy or sell a security; and are not warranted to be correct, complete or accurate. Morningstar, its affiliates, and third-party content providers are not responsible for any investment decisions, damages or losses resulting from, or related to, the data and analyses or their use. To the extent any content is general advice, it has been prepared for clients of Morningstar Australasia Pty Ltd (ABN: 95 090 665 544, AFSL: 240892), without reference to your financial objectives, situation or needs. For more information refer to our Financial Services Guide. You should consider the advice in light of these matters and if applicable, the relevant Product Disclosure Statement before making any decision to invest. Past performance does not necessarily indicate a financial product’s future performance. To obtain advice tailored to your situation, contact a professional financial adviser. Articles are current as at date of publication.
This website contains information and opinions provided by third parties. Inclusion of this information does not necessarily represent Morningstar’s positions, strategies or opinions and should not be considered an endorsement by Morningstar.