Record low bond yields have supported the valuations and profitability of Australian real estate investment trusts (A-REITs) over the past few years. A-REITs outperformed equities in 2014 (26.8% vs 5.3%) and 2015 (14.4% vs 2.8%).
The A-REIT/bonds correlation has been about -0.5% in 2016 (Figure 1), one of the highest on record. As a result, A-REIT prices have been driven down more by bond yield movements than other factors such as the real estate cycle.
Figure 1: 10 Year Bond Yields & A-REIT Total Returns: 12 Months to 31 October 2016

In recent months the yield curve has steepened as markets embrace increased fiscal stimulus from China and Japan and now the US (following Donald Trump’s election victory), and greater expectations of higher global inflation. Australian bond yields have followed, rising from a low of 1.8% in August 2016 to 2.3% at the end of October 2016. Since then, they’ve risen a further 0.40% to 2.7%.
Property trust prices continue to fall
This year, what was looking like another solid period for A-REITs is in danger of evaporating. Since the start of August, the sector has fallen 18.7% and is now down 2.8% YTD, while equity prices are up marginally YTD.
A-REITs aren’t alone. Global listed REITs in the US, UK, Singapore, and Hong Kong are down, while listed infrastructure and utilities equities have also been sold off.
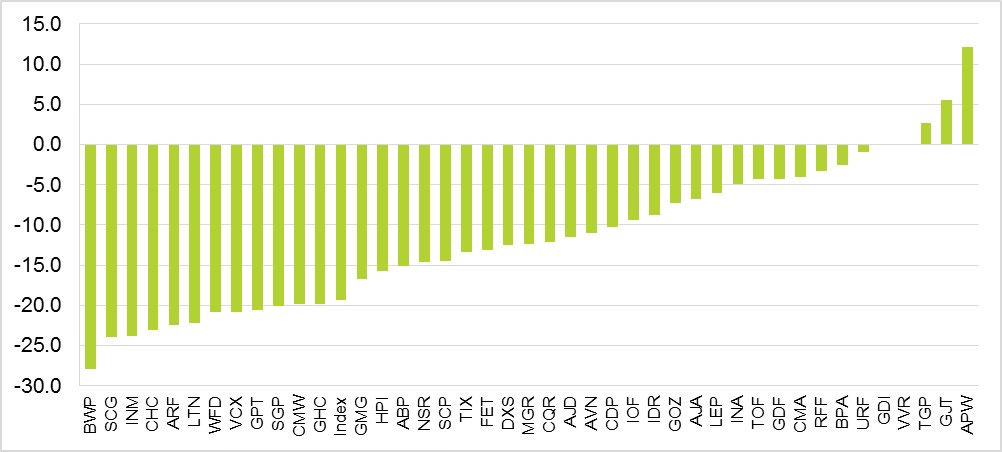
Figure 2 ranks A-REITs in terms of price performance since August 2016. The largest have been hit the hardest – Scentre (SCG down 24.0%), Westfield (WFD down 20.9%), Vicinity (VCX down 20.9%), GPT (GPT down 20.6%) and Stockland (SGP down 20.1%) at time of writing.
In the hunt for yield, these large cap A-REITs have been well supported in recent years by generalist equity funds who have taken advantage of the liquidity they offer to park their money there. It is therefore not surprising that when the herd stampeded towards the exit then switched into more cyclical, growth-oriented stocks, the largest, most liquid A-REITs were hit hard.
Figure 2: A-REIT Price Movements, 1 August to 16 November 2016
With the recent sell-off, the A-REIT dividend yield has risen from 4.2% in July to 5.3%, but there is still a cushion of 260bps relative to the 2.7% 10-yr bond yield, which is above the long-term average of a 196bps spread.
The current yield is based on an average payout ratio of 84%, well below the 100% recorded pre-GFC, not that one wants to see A-REITs go back to those dark old days to boost their distribution yield.
The A-REIT sector is now trading at a price to NTA premium of circa 14%, down from 50% in July. There have been seven periods over the past 25 years when bond yields rose by more than 60 basis points. Figure 3 shows the performance of A-REITs relative to equities in each of these periods.
Figure 3: A-REIT and Equities Performance in Periods of Rising Bond Yields
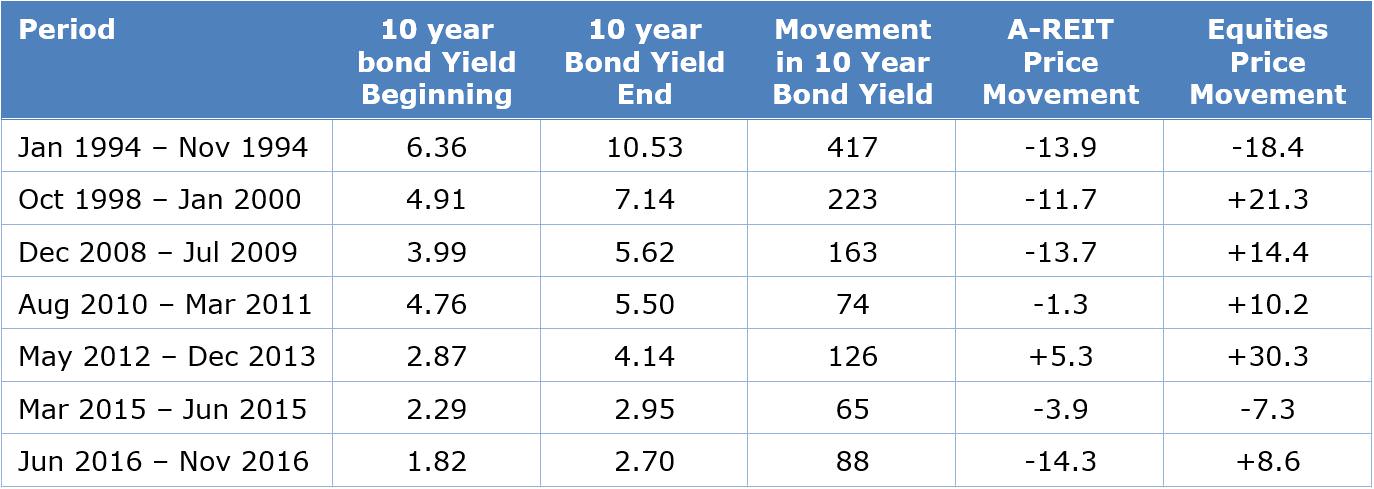
A-REITs produced positive returns in only one period of rising bond yields (January–November 1994), a period when A-REITs also outperformed equities.
This time round we’ve seen the largest A-REIT sell-off compared with other periods of rising bond yields, despite the fact that bond yields have not risen as much as they did in 1998–2000 and December 2008–July 2009.
The extent of the recent sell-off is not surprising given the level to which bond yields fell and A-REIT prices rose. The dramatic bond sell-off over a short period has affected many yield-sensitive investments, and A-REITs have not been immune.
Will the pendulum swing back?
The question investors need to ask is whether the rapid rise in bonds will continue and A-REIT prices fall further, or has the pendulum swung too far, too quickly?
The A-REIT sector will remain captive to the gyrations of capital markets in the short term. Clearly, if bond yields continue to rise further there could be additional price risk.
However, the recent sell-off in the A-REIT sector has created some attractive buying opportunities. Investors with a longer-term view who can see out the short-term volatility can acquire some of the best real estate in Australia at more attractive prices than they could have three or four months ago.
Overall, A-REITs are in relatively good shape and almost incomparable to those in the lead up to the GFC. Gearing is lower (circa 30%), refinancing risk over the next few years is low (the majority of debt is due to expire in 2021 and beyond), asset quality has significantly improved, payout ratios are respectable and the exposure to offshore real estate is limited (Goodman and Westfield are the two exceptions).
Yet now is not the time to take a passive approach to the sector (i.e. indexing). We expect the variation of performance across the A-REIT universe to widen in the year ahead. Individual characteristics of each A-REIT will be more of a key performance driver than it has been in the past year or so.
Investors need to focus on those A-REITs that have quality management and can generate real value from their portfolios rather than simply relying on lower debt costs to support earnings and firming cap rates (property yields) to drive underlying asset values higher. As Warren Buffet says, “Only when the tide goes out do you discover who’s been swimming naked.”
Adrian Harrington is Head of Funds Management at Folkestone Limited (ASX:FLK). Folkestone is a sponsor of Cuffelinks. This article is general information and does not consider the circumstances of any individual.