GDP was 0.3% for the September quarter and while headlines highlight that this is 0.1% below expectations, the true story is that this was Australia’s seventh[1] consecutive quarter of negative GDP per capita growth.
This is the longest period of consecutive negative GDP per capita growth since records started in June 1973. Since that time, Australia has only recorded one other period of more than two consecutive negative quarters, and that was four negative quarters from September 1982 to June 1983.
Immigration: continuing the GDP free kick, but for how long?
A major flaw in the GDP measure that especially affects Australia is the free kick provided by population growth, which, in Australia’s case, means immigration.
Looking back 50 years to 1973 (when the per-capita series starts), population growth has provided nearly 50% of the GDP growth, with GDP growing at a 2.9% compound average rate, compared to GDP per capita, which has averaged 1.5%.
GDP per capita has had double the negative quarters
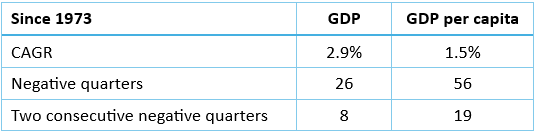
Table 1 shows a similar pattern regarding the number of negative quarters and recessions (defined as two consecutive quarters or negative growth). Since September 1973, GDP per capita has registered 56 negative quarters compared to GDP, which recorded only 26. Similarly, GDP has recorded only eight consecutive negative quarters compared to 19 for GDP per capita.
Table 1: Population growth has delivered almost half the total GDP growth
Source: ABS, Venn Brown
Immigration is the magic lever to which governments (of all colours) have become addicted in order to boost GDP (and housing prices). If GDP looks to be slowing, just let a few hundred thousand more people into the country and watch the GDP grow.
There has been some speculation that the growing discontent with the ongoing housing crisis and cost of living pressures might see the end or at least the easing of this policy.
However, no politician wants to be the one that ushers in a GDP-measured recession or, worse still, a meaningful decline in house prices. As such, we don’t see a major change in immigration in the near term.
Figure 1: Population growth is responsible for almost half the total GDP growth
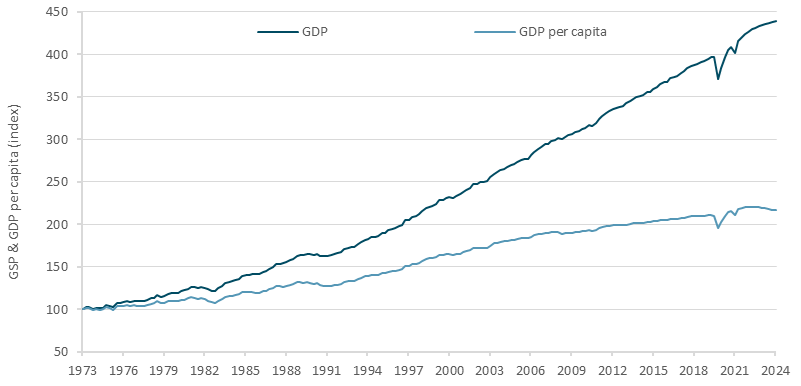
Source: ABS, Venn Brown
While all the talk is on the cost of living and inflationary pressures, it’s worth noting that while the government has been proudly reporting unbroken economic growth, GDP has been negative for eight of the last nine quarters on a per capita basis.
As mentioned above, this is only the second time since June 1973 that there have been more than two consecutive quarters of contraction; the other lasted four quarters from September 1982 to June 1983.
Figure 2: GDP per capita has been negative for just eight of the last nine quarters
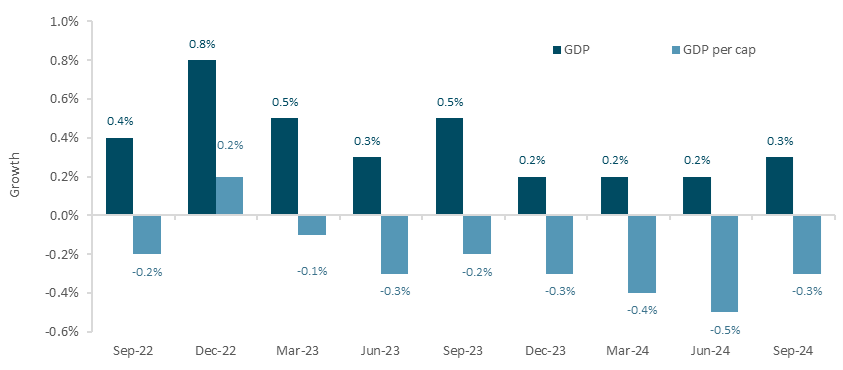
Source: ABS, Venn Brown
Figure 3 below shows the cumulative number of negative quarters of GDP and GDP per capita, highlighting the separation of the two measures as immigration increased in the early 90s and gained real speed over the last three years.
Figure 3: GDP per capita has been negative for just eight of the last nine quarters
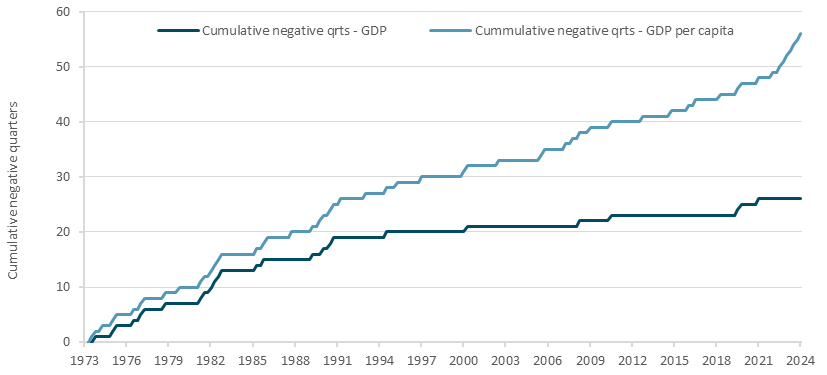
Source: ABS, Venn Brown
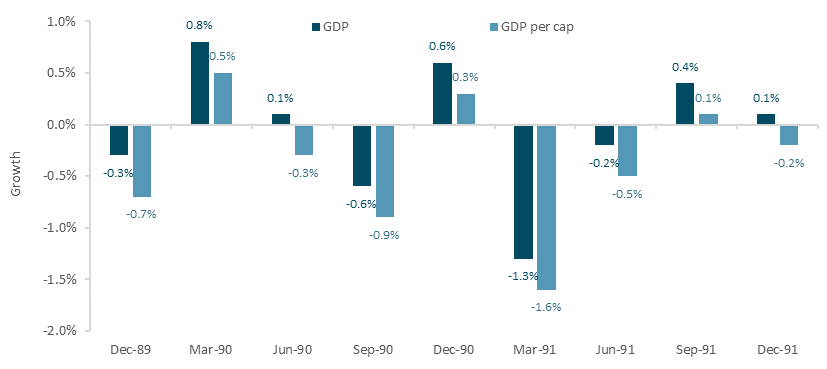
The 1990/91 recession was shorter but far more intense
An interesting reference for the current period is the 1990/91 recession (see Figure 4), during which per capita GDP was negative for six of nine quarters, compared to GDP, which was negative for four of the nine.
That’s not to say we’re even close to a similar economic downturn. Back in 1990/91, there were three key differences to our current environment, the most important of which is unemployment:
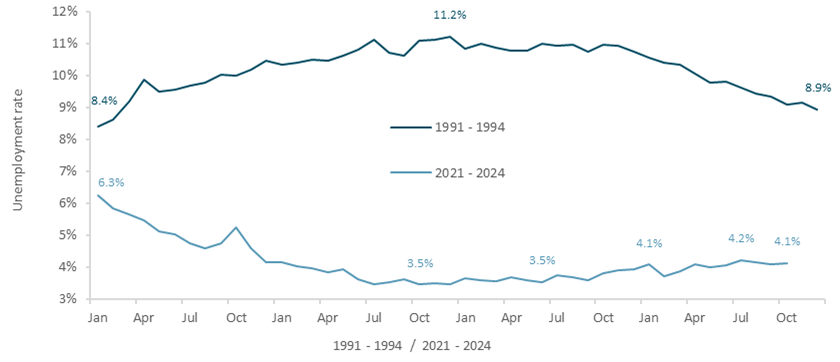
- Unemployment: Seasonally adjusted unemployment peaked at 11.2% in December 1992, compared to today’s persistent, near-record low of 4.1% in October (albeit up from 3.5% in October – December 2022). See Figure 5;
- Negative GDP: Actual GDP was negative for three quarters, bottoming with a -1.3% contraction in March 1991; and
- Magnitude: At the bottom, the magnitude of the negative GDP per capita was double to triple the current levels.
Figure 4: 1990/91 recession had six out of nine negative quarters of per capita GDP
Source: ABS, Venn Brown
Unemployment remains the key factor to watch
While seasonally adjusted unemployment is up 0.7 percentage points from its low of 3.5% in December 2022, it remains near record lows and less than half the rate that resulted from the 1991/1992 recession.
Unemployment and credit defaults remain the key indicators to watch as GDP continues to slow, interest rates remain moderate, and inflation continues to add to cost of living pressures.
Figure 5: Unemployment in 1991 – 1994 was very different to current rates
Source: ABS, Venn Brown
[1] GDP per capita for the March 2023 quarter was revised down from 0% to -0.1% in the September release.
Andrew Wilkinson is the Managing Director of Venn Brown, a special issuer sponsored equity research company.