You know that scene. The one where the hero is dying of thirst, crawling on their hands and knees across the scorching desert sand. They spot an oasis on the horizon … with a life-giving water hole. They keep crawling, but the oasis never gets any closer.
It’s a mirage.
Well, that’s what it’s felt like with a US recession this cycle. Economists have been calling it for ages, but like the oasis it never seems to arrive. And, of course, like a mirage, it still may never arrive.
But consensus from economists puts a recession at a 65% probability (Bloomberg) over the next year. That’s as close to a sure thing as economists would ever call. Investors need to be prepared for the mirage to suddenly become material.
So now is a good time to look at what investors should expect if a recession does arrive in the next year in the US.
What, if anything, should share market investors do about it?
Below, we look at seven ‘truths’ and insights for investors, including who will be to blame for a recession, the prospects of timing the bottom, and how we are positioning our own portfolios for a possible US economic downturn.
1. It’s the Fed who will likely cause a recession
Since World War 2, on average, there has been about one U.S. recession every 6-7 years (12 in total). On average they have lasted a little less than a year (10 months).
What causes them?
Well, the ultimate cause (if there is ultimately just one) is hotly debated amongst economists (though I’m not sure big crowds are turning up for the debate!), but the proximate cause is usually a central bank increasing interest rates to cool an overheating economy.
US recessions tend to line up nicely around the end of the US Federal Reserve’s rate hiking cycles. The key exception in modern times is the 1995 rate cycle, which resulted in a soft landing and no recession.
2. Small caps get hurt the most in recessions
So, when recession has hit in the past, what has been the share market fallout?
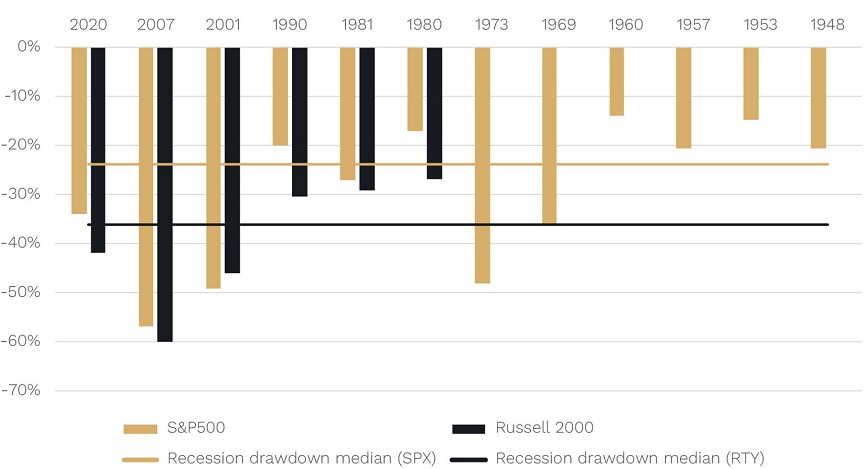
Below, we show the drawdowns (peak to trough falls) for both US large caps (S&P500) and US small caps (Russell 2000).
The share market hit
Source: Factset.
The median drawdown for large caps has been -24% and for small caps -36% (though the available data doesn’t go back as far for small caps).
What you can also see is that outside the 2001 dot com bursting episode and the associated recession, small caps have fallen farthest. This is generally expected in a recession because:
- Investor generally seek the greater liquidity and higher and more certain dividends of more mature large caps; and
- Small caps tend to be less diversified businesses with on average weaker balance sheets than large caps.
3. Small and big cap stocks have already recorded recession-like falls
How does this stack up to the current maximum drawdowns experienced so far for US large and small caps?
At writing, large caps have fallen -25% to their lows in October 2022, while small caps have fallen -32% to their lows in June 2022 (both since have partially rebounded).
So, while a recession has not occurred this cycle in the US (at least so far), during the most recent sell off starting in 2021/2022, both US large and small caps have already fallen by a similar amount to their recession averages.
This gives some hope that even if a recession does eventuate, the downside may be more limited from here.
4. Stocks surge back after recession falls
The other good news is that even if a recession does eventuate, the subsequent returns from the associated market lows over the next 6-12 months tend to be very healthy.
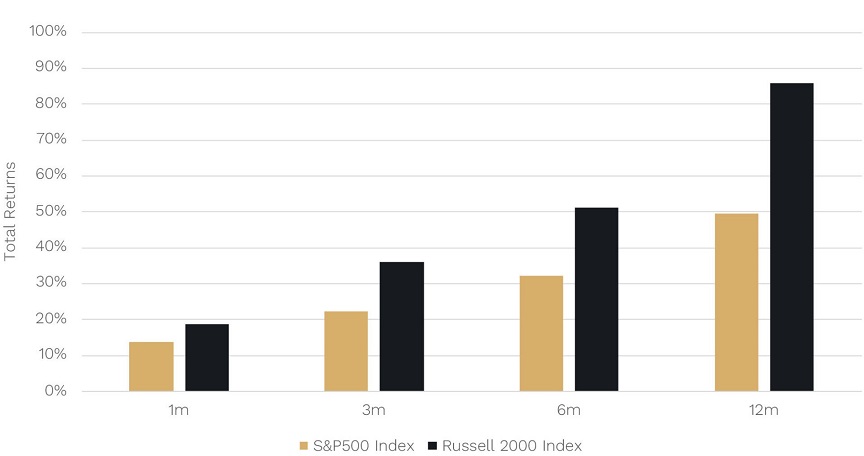
Below we show the average returns in both US large and small caps in the 1, 3, 6 and 12 months post their recessionary lows.
The share market recovery from recessions
Source: Factset
While, as mentioned, small caps tend to fall farthest, they also tend to recover the strongest on the other side. In fact, the average six-month returns for US small caps are over 50% … and a whopping 85% over 12 months.
As a small-cap manager this is one of the reasons we must be prepared for what is usually a very sharp share market recovery on the other side, should a recession eventuate.
5. Trying to time the bottom? It’s a fool’s errand
The natural question to then ask is: if a US recession looks quite likely and US share markets tend to fall heavily in a recession, shouldn’t I just sell out now and buy back in when it looks like the market is staging what is usually a big recovery on the other side?
While superficially this may seem appealing (and believe me if it were possible, we would certainly do it), it is highly unlikely to be consistently and successfully achievable by an investor for two key reasons:
Firstly, a recession is not assured.
While, as we noted above, the consensus probability of a recession in the next year according to Bloomberg is 65%, of the 60 economic forecasters surveyed, their probabilities currently range from 30% to 100%.
Bottom line, a recession is no sure thing.
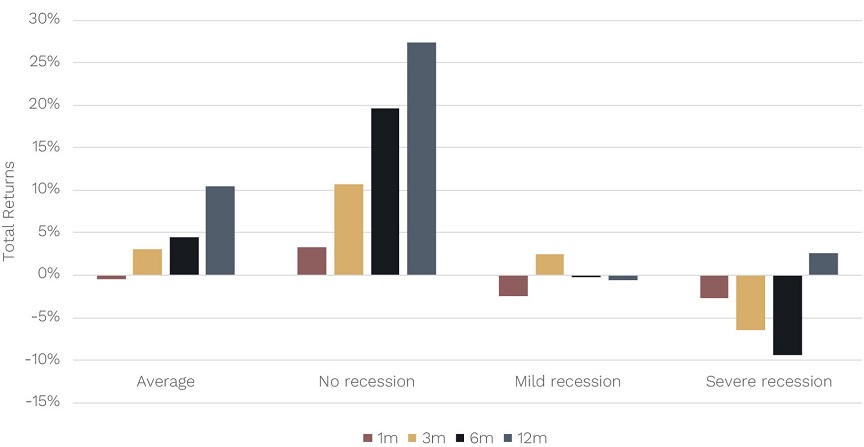
Take, for example, the chart below which shows the S&P500 return outcomes over the next 12 months after the last Federal Reserve hike depending on whether no recession, a mild recession or a severe recession occurred.
Why market timing around recessions is a fool’s errand
Source: Factset
As you can see, if no recession does eventuate then history suggests it is ‘off to the races’ for the share market.
That’s not something you’d want to miss if you sold out of the market preparing for a recession. This is particularly relevant now as commentators debate whether we have already seen the last rate hike this business cycle.
Secondly, timing market bottoms during a recession is virtually impossible.
History suggests that if a recession does eventuate, out of the 12 US recessions since World War 2, the share market has never bottomed before the recession has started.
When has it tended to bottom in these recessionary periods?
With the exception of the 2001 dot com crash, where the U.S. share market bottomed after the end of the associated recession, it has always bottomed after the recession start, but before the recession end.
On average, in fact, if we remove the 2001 dot com crash, of the 11 other post-WW2 recessions, the share market has bottomed on average 47% (or almost exactly half) of the way through the recession.
But before those recession absolutists think of using that as a market timing tool, the range in those 11 recessions has been a bottom as early as 15% of the way through the recession, to as late as 79% of the way through.
Given history suggests the market recovery can start at wildly different points during the recession, and the recovery itself, as highlighted earlier, is generally very swift, the odds of getting it wrong by trying to market time are high.
So, staying largely invested seems to us to be the most sensible course of action.
But are there any types of areas of the market investors could benefit from skewing to given a heightened recession probability?
6. Some sectors will lead a recession recovery
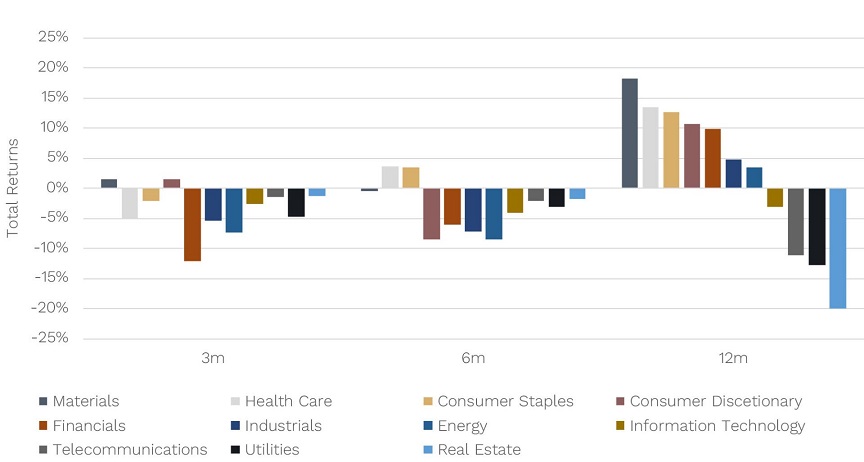
Enter the chart below. It shows historically which US sectors have performed the best 3, 6 and 12 months after a recession has started.
Where to invest instead
Source: Factset
What you can see is it tends to be the most resilient, less macroeconomically sensitive consumer staples and healthcare sectors that fare the best, holding their ground.
This makes sense because, while consumer spending pulls back in a recession, they tend to pull back less on things like groceries or medical costs.
By the 12-month mark, returns in most sectors tend to be positive ,with more cyclical sectors such as materials and consumer discretionary joining in and helping lead the rally as the market looks forward to the economic recovery ahead.
Again, this makes sense. Usually by this stage the recession is over or nearing its end and forward-looking share markets seek out those businesses that will benefit from a recovery in demand which tends to boost commodity prices and discretionary expenditure.
7. We are cautious, but not overly so
In sum, at Ophir, we still remain incrementally cautiously positioned in our funds given heightened recession risks, but not overly so.
We are remaining largely invested, with only slightly higher-than-usual levels of cash.
Most importantly, though, our largest positions are in those companies that we believe have strong growth prospects, but where that growth is less reliant on strong economic growth.
Usually, that is because the company’s goods or services are seen as more of a necessity by their customers, or they have unique attributes versus their competitors which is allowing it take market share, or both.
An example of this in our Australian equity funds is AUB Group, one of Australia’s leading insurance brokers to businesses. It operates in an industry that has proved itself resilient to economic contractions in the past as businesses seek to hold on to their policies in a heightened risk environment.
Hopefully this article has shed some more light on when and if a recession might occur near term and some lessons from history on what to expect if it does. And, perhaps most importantly, how we are thinking about portfolio positioning as a result.
Andrew Mitchell is Director and Senior Portfolio Manager at Ophir Asset Management, a sponsor of Firstlinks. This article is general information and does not consider the circumstances of any investor.
Read more articles and papers from Ophir here.