Register For Our Mailing List

Register to receive our free weekly newsletter including editorials.

Home / 258

SMSFs allocating to managed funds and global

Three recent reports on asset allocation confirm a move by SMSFs and other investors into global equities at the expense of Australian companies. It is no doubt driven by the better performance of the S&P500 versus the S&P/ASX300, the surge in technology opportunities offshore and the struggles of previous favourites, the banks and Telstra.

The official statistics on the asset allocation of SMSFs as recorded by the Australian Taxation Office (ATO) from tax returns are flawed, as we have written about several times. Other data sources such as the Australian Bureau of Statistics (ABS) and market participants provide a more complete picture.

The managed fund industry

The latest ABS data for 31 March 2018 shows the Australian managed fund industry held $3.4 trillion, up $15 billion in the quarter. So much for the claims this is a struggling industry. The strongest increase by investment type was overseas assets, a rise of $21 billion, as shown below. Domestic shares fell by $18 billion.

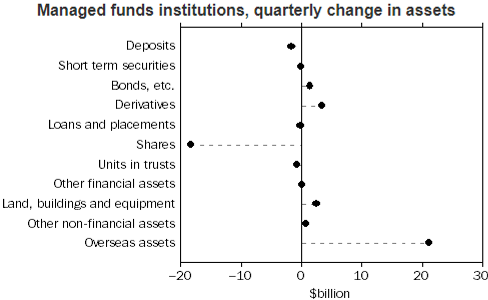
Source: 5565.0 ABS Managed Funds, Australia, March 2018

SMSF investments move to managed funds

The just-released 2018 Vanguard/Investment Trends Self-Managed Super Fund Reports show a time series since 2012 in investment patterns. The most obvious movement is the growth of managed investments, which include ETFs and LICs, at the expense of direct shares. While SMSF trustees are making their own investment decisions, this should not be confused with making their own stock selections. The share of managed investments has doubled from 11% to 22% in six years. The latest BetaShares Australian ETF Review shows inflows into international equities of $273 million in May 2018, with this asset class first for inflows in every month of 2018 so far.

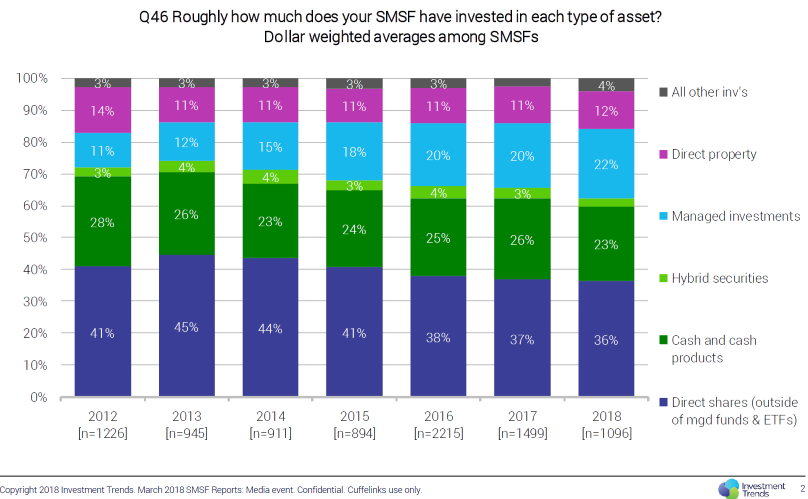
Source: Vanguard/Investment Trends Self-Managed Super Fund Reports, June 2018

SMSF asset allocation

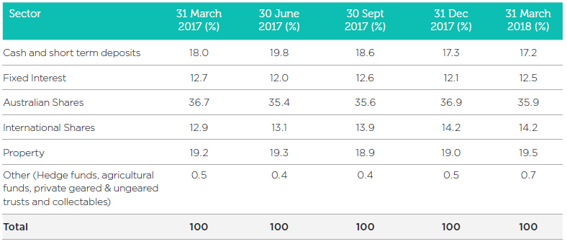
This week, SuperConcepts also released its latest Investment Patterns Survey for March 2018. This is far more up-to-date than the ATO data because it uses SMSF data from funds administered by SuperConcepts, rather than relying on the much-delayed lodgement of tax returns.

The data needs the qualification that SuperConcepts is part of AMP and has a higher proportion of advised clients than most SMSF administrators, and advisers tend to use the functionality of platforms and managed funds. Nevertheless, the change in asset allocation also shows a greater use of international equities over time, up from 12.9% to 14.2% in a year.

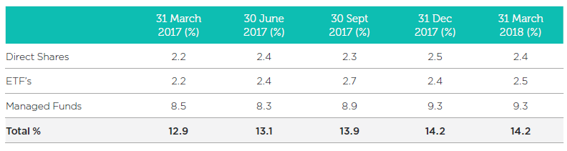
A further break-up of the international shares component over the last year shows the steady rise of ETFs and managed funds, and a small rise in SMSFs going directly into foreign stock exchanges.

SMSF international shares components

The balanced options of institutional superannuation funds have long allocated around 20% of their portfolios to global equities, and SMSFs have traditionally lagged far behind. In the last five years, SMSFs have started to catch up, and with the Australian index still dominated by some big companies without compelling growth prospects, it's a trend that will continue.


Graham Hand is Managing Editor of Cuffelinks.


  •   14 June 2018
  • 2
  •      
  •   
2 Comments
Peter C
June 18, 2018

For the past few years I have invested in the indexed option of my industry super fund.

The international share component has ranged from 30% to 38% during this period (it is 38% now). The increase is mainly because of the natural growth and not because of a switch.

The benefit for me is, I don't have to think about it and don't start investing overseas after the prices of stocks have already increased, I've been in there for a while.

Also, because I used the indexed option the fees are significantly lower than a regular balanced option.

There is still 30% of the portfolio allocated to cash and fixed interest, so I do have a balance between growth and income assets.

SMSF Trustee
June 19, 2018

It would be good to see the ranges for these, if they were available. I'm with Super Organised so my allocation can be validly compared with their data. But my allocation is quite different, so I'd love to see if I'm at the extreme of any ranges.

For example, I've got 7% in what they call "other". I'd guess that the average of 0.7% is made up of lots of funds with zero and a small proportion with significant allocations. Is 7% a large allocation, the average of the non-zeros, or a whimpish allocation from among those who go into that space?

It's great to see this data and I appreciate your comment about the difference between having an SMSF to pick stocks versus having one to hold the managed funds of your choice. I have less than 10% of my fund in direct shares (and that's been reducing over the last year or two). The vast majority is in 25 different managed funds offered by 20 different fund managers.

Great diversification, competitive fee structure, no one else to blame but me for the results - that's why I'm there.


Leave a Comment:

RELATED ARTICLES

SMSF asset allocation changes unexpected

Let’s debunk this myth about SMSFs and global shares

SMSFs drop the ball on risk in asset allocation

banner

Most viewed in recent weeks

How cutting the CGT discount could help rebalance housing market

A more rational taxation system that supports home ownership but discourages asset speculation could provide greater financial support to first home buyers.

Is there a better way to reform the CGT discount?

The capital gains tax discount is under review, but debate should go beyond its size. Its original purpose, design flaws and distortions suggest Australia could adopt a better, more targeted approach.

Want your loved ones to inherit your super? You can’t afford to skip this one step

One in five Australians die before retirement and most have not set up their super properly so their loved ones can benefit from all their hard work and savings. 

Super is catching up, but ageing is a triple-threat

An ageing Australia is shifting the superannuation system’s focus from accumulation to the lifecycle of retirement. While these pressures have been anticipated for decades, they are now converging at scale and driving widespread industry change.

Meg on SMSFs: Last word on Div 296 for a while

The best way to deal with the incoming Division 296 tax on superannuation is likely doing nothing. Earnings will be taxed regardless of where the money sits, so here are some important considerations.

Has Australia wasted the last 30 years?

The 20 years after Peter Costello left Treasury have been deemed wasted...by Peter Costello. The missed opportunities for Australia began long before.  

Latest Updates

Taxation

3 ways to defuse intergenerational anger

With the upcoming budget increasingly likely to include bold proposals to alter the tax code I’ve outlined three incremental steps with fewer unintended consequences.

Economy

Why an extended US-Iran war will punish mortgage holders

The impact of the Iran War is far more than expensive petrol. Higher oil prices have secondary inflationary impacts that reverberate throughout the economy which could be bad news for Australians with mortgages.

Infrastructure

Don’t forget the yield

Global Listed Infrastructure dividends are forecast to grow 5-6% p.a over the next two years. After a hiatus, share buybacks are back on the agenda and will play an integral role in shareholder returns.

Iran war hands politicians free ticket to blame oil prices for inflation

Past oil shocks offer lessons for investors dealing with the fallout from the Iran War and the ongoing impact on inflation.

Economy

Japan 2026: A new PM heralds a new golden age?

Former Australian Prime Minister, Paul Keating, once said "When you change the government, you change the country." We're about to see whether that holds true in Japan.

Investment strategies

Why are central banks moving from US Treasuries to gold?

Central banks now hold more gold reserves than US Treasuries, signalling a shift in safe-haven asset strategy and portfolio diversification as geopolitical risks increase.

Strategy

Has global human wellbeing peaked? What the data reveals

Historically economic progress is measured by GDP growth but there is an increasing body of work that explores quantitative measures of wellbeing.

Sponsors

Alliances

© 2026 Morningstar, Inc. All rights reserved.

Disclaimer
The data, research and opinions provided here are for information purposes; are not an offer to buy or sell a security; and are not warranted to be correct, complete or accurate. Morningstar, its affiliates, and third-party content providers are not responsible for any investment decisions, damages or losses resulting from, or related to, the data and analyses or their use. To the extent any content is general advice, it has been prepared for clients of Morningstar Australasia Pty Ltd (ABN: 95 090 665 544, AFSL: 240892), without reference to your financial objectives, situation or needs. For more information refer to our Financial Services Guide. You should consider the advice in light of these matters and if applicable, the relevant Product Disclosure Statement before making any decision to invest. Past performance does not necessarily indicate a financial product’s future performance. To obtain advice tailored to your situation, contact a professional financial adviser. Articles are current as at date of publication.
This website contains information and opinions provided by third parties. Inclusion of this information does not necessarily represent Morningstar’s positions, strategies or opinions and should not be considered an endorsement by Morningstar.