When Charles Dow, a journalist, developed the Dow Jones Industrial Index in 1896, the abacus was still widely used to make calculations. Arithometers, which were invented by Charles Xavier Thomas de Colmar in 1820 and in commercial production by 1851, were also a common sight.
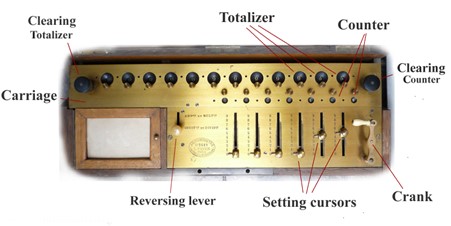
Source: arithmometre.org
Commercial production of the arithmometer ended around 1915 and abacuses are largely confined to primary schools these days. Meanwhile, the Dow Jones Index is still widely quoted. Let's start by looking at how it is constructed.
The Dow Jones is a (share) price-weighted index, which means that the stocks with the highest price have the largest weighting. This would have been the easiest way to create an index with the calculation tools available at the time.
Currently, UnitedHealth Group, which has a price of US$585 per share, has the highest weighting in the portfolio at 9.6%. By contrast, Apple is roughly six times larger than UnitedHealth in terms of market cap yet only makes up 3.5% of the Dow Jones.
The Dow Jones provides a general barometer of US equity performance. But it does not make any sense from an investment perspective because a share price could be a function of having fewer (or more) shares on issue. A share price, by itself, is not useful for making investment decisions.
After World War I and the next type of indices
At the turn of the 20th century, new mechanical calculators were usurping the arithmometer as the calculator technology of choice. The comptometer, the Burroughs adding machine and Odhner’s arithmometer became the calculators of choice.
Indices evolved as they were able to embody more complex calculations. The next major innovation was ‘market capitalisation’, which was pioneered by Henry Varnum Poor and the Standard Statistics Co.
The result was the 1926 predecessor of the United States’ S&P 500. A market capitalisation index uses the size of a company for inclusion. Therefore, in a market capitalisation index, the larger companies have bigger weights. In the S&P 500, Apple makes up around 6.7% and UnitedHealth around 1.2%.
Market capitalisation indices were considered better barometers of the market, so became the source of data quoted in finance news. Again though, the index was intended to be a market barometer, not a tool for investment.
In the 1950s, research by Harry Markowitz and William Sharpe supported market capitalisation indices as an investment tool. This is the Theory of Efficient Markets. Based on this theory, market capitalisation-weighted indices deliver the best returns for the least risk. It was thought that you cannot outperform the market unless you take on additional risk.
But there are numerous examples where the market has been wrong. There have been periods of irrational buying and selling and there have been periods during which bubbles have formed.
Consider too, the differing needs of individual investors and institutions. Each has a unique reason for buying and selling shares and could assign a different value to different aspects of the financial transaction which is often unrelated to the valuation. For example, investors sometimes trade for tax, income or even emotional reasons. As a result of these factors, the market is not efficient in reality.
By the 1970s, professional fund managers were aiming to exploit these inefficiencies, targeting returns above market capitalisation indices.
Computers, ‘big data’ and the next wave of indices
By now IBM had created mainframes, and the desktop computer was becoming a reality. The first handheld programable calculator, the HP-65 was released in 1974 at US$795 (Nearly US$5,000 in today’s dollars).
Computers and calculators were getting faster, smaller and cheaper. Savvy active fund managers were able to use some of this technology to their advantage.
An active fund manager proactively makes decisions over which investments are bought or sold, generally with the aim of outperforming a market index. This is done via a mix of qualitative and quantitative research, personal judgement and forecasting, so computing technology and its implementation could be a competitive advantage.
When actively managed funds were first offered to investors, performance was uncertain, and the costs were high. Sometimes the returns were good, but often they were not. Many people found this a poor bargain, so preferred lower-cost passive funds which tracked market capitalisation indices. In these passive funds, returns were not high, not low, just the market average. The rise of ETFs this century has largely been driven by demand for these passive funds.
At this stage, passive funds only tracked market capitalisation indices. However, sophisticated investors in passive funds started to consider the possibility that alternate index weightings, different from market capitalisation, could give investors higher returns for the same, or even lower levels of risk.
Alternate index construction methods started to focus on grouping companies with common valuation characteristics, common balance sheet qualities and common fundamentals to screen or weight stocks, including equal weighting constituents.
These innovative index construction techniques became known as ‘smart beta’. They are ‘smarter’ because they take a more considered approach to what goes into the index, other than just the size of the company.
These index innovations have been driven by a combination of investors seeking investment outcomes beyond benchmarks and the advent of technologies like ‘big data’ that enabled financial professionals to better leverage the data in financial reports, performance data points and mathematical algorithms to target these outcomes.
Unlike market capitalisation indices, these ‘smarter’ indices are created with an investment outcome in mind and were not created initially to represent the performance or health of the share market.
We like to say smart beta combines the best of active and passive investing: having the potential for better investment outcomes while being rules-based, transparent and cost-efficient.
Arian Neiron is CEO and Managing Director - Asia Pacific at VanEck, a sponsor of Firstlinks. This is general information only and does not take into account any person’s financial objectives, situation or needs. Investors should do their research and talk to a financial adviser about which products best suit their individual needs and investment objectives.
For more articles and papers from VanEck, click here.