Is asset allocation more important than stock selection? We certainly believe so, and the turbulence of markets in recent times has highlighted the need for a well-diversified portfolio with downside protection.
This is the goal of our multi-asset strategy. Every six months we pore over a raft of economic data, in order to review and reset our core asset allocation. The latest review, completed in April 2020, captured one of the most dramatic periods in recent economic history.
Here’s what we made of it.
Raging bull meets ferocious bear
In our December 2019 review, the question on everybody’s minds was: how long would this bull run last? Now, the question is: how long will this downturn last?
The conversation has flipped 180 degrees in a matter of months.
In our latest review, we tracked every market crash (a fall of 20% or more) since 1929, in terms of how long it took the United States’ key stock market index, the S&P 500, to recover to the same level it had reached immediately before the crash.
While the Great Depression recovery blew out to 266 months, it took as little as three months for other crashes to make up lost ground. Excluding the Depression, however, the average recovery period was 27 months.
Figure 1: Market falls and recoveries since 1929
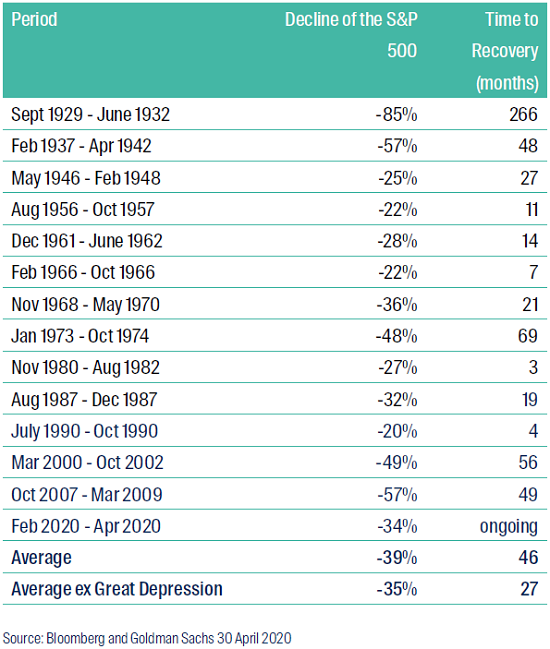
That means, if this is an ‘average’ crash, then it’s likely that a recovery will take two years or more. But averages can be misleading. At this stage, we simply don’t know the true scale of this downturn.
Our team took a somewhat sober view of the outlook, and incorporated a filter for highly-turbulent regimes in the recent asset allocation review.
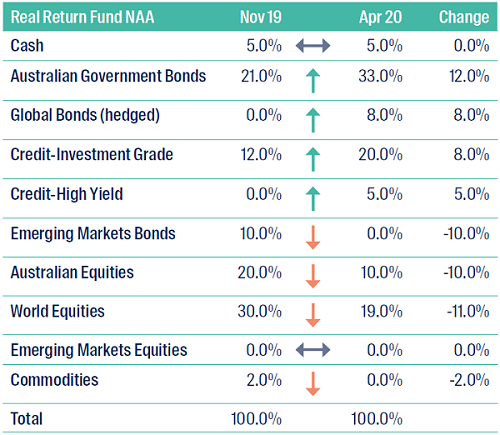
This prompted us to make a significant cut to our equities exposure: the collective weight to Australian and global equities has gone from 50% to 29% (comprised of 19% global equities and 10% Australian).
The key reason is that we are cautious about the continued knock-on effects from the COVID-19 outbreak. While equity markets may be trying to look through into a more optimistic future, we think it could be premature.
Government support for fixed income: a gamechanger
A key difference between this and other downturns of the last 100 years is the unprecedented fiscal and monetary stimulus. Australia’s fiscal stimulus is among the largest in the developed world, at 6.9% of GDP (in line with the UK and US, both at 6.9% - according to the International Monetary Fund (IMF) as at 8 April 2020). This has been adjusted from earlier higher estimates due to the $60 billion lower stimulus from JobKeeper.
Governments around the world have pumped money into the economy to try to stave off economic disaster. However, these initiatives will have an expiration date which may - or may not - align with the length of the downturn.
With this support in mind, a notable change to our portfolio is the increased exposure to bonds and credit. We increased Australian Government Bonds from 21% to 33% of the portfolio, investment-grade credit from 12% to 20%, while global bonds went from zero allocation to 8% and high-yield credit from zero to 5%.
Figure 2: CFS Multi-Asset Real Return Fund Neutral Asset Allocation (NAA) as at April 2020
We made this decision after taking a view on where we think the global economy is moving, and the likely long-term values for inflation, risk free rates, long-term bond yields and earnings growth. We then tilt the asset allocation based on this outlook.
Our team likes investment grade and high-yield credit at the moment, as we believe it delivers a lower risk portfolio at the aggregate level, especially with strong central bank support. The US Federal Reserve and the European Central Bank have indicated that they will not only be purchasing government bonds and investment grade credit, but for the first time, quality high-yield bonds too.
This is a game-changer for fixed income, particularly in a portfolio context, and it’s one reason why we are reducing risk away from higher volatility equity allocations.
Although government bonds were occasionally caught up in the recent sell-off, alongside riskier assets like equities, we saw the traditional relationship between the two asset classes play out as we hoped: government bond exposures provided diversification to equity exposures during the increased volatility in March.
While liquidity was temporarily scarce, central bank initiatives to inject capital back into the economy subsequently eased anxieties. Given the need to manage risk in the portfolio, our allocation to Australian government bonds has increased significantly, but remains concentrated in shorter maturities.
Managing risk over time
We don’t rely solely on the six-monthly neutral asset allocation (NAA) to construct our portfolio. We also have the benefit of dynamic asset allocation (DAA) which is reviewed weekly and allows us to make investment changes based on shorter-term market dynamics.
While individual investors would find it difficult to manage these two styles of asset allocation, the combination has allowed us to deliver additional returns and reduce portfolio risk, at the same time as meeting our real return objective. Having that flexibility built into our approach is helpful in times like these.
Even if you lack the firepower of a team of professional analysts, there are still lessons to be taken from our multi-asset strategy. In particular, the observation that macro events and economics have a significant impact on market and portfolio risk. As such, it can be appropriate to make asset allocation changes that reflect the current environment as well as the economic outlook.
Kej Somaia is Co-Head of Multi-Asset Solutions at First Sentier Investors (Australia), a sponsor of Firstlinks. This material contains general information only. It is not intended to provide you with financial product advice and does not take into account your objectives, financial situation or needs.
For more articles and papers from First Sentier Investors, please click here.