Register For Our Mailing List

Register to receive our free weekly newsletter including editorials.

Home / 493

Asset Class Gameboard shows all good things must end

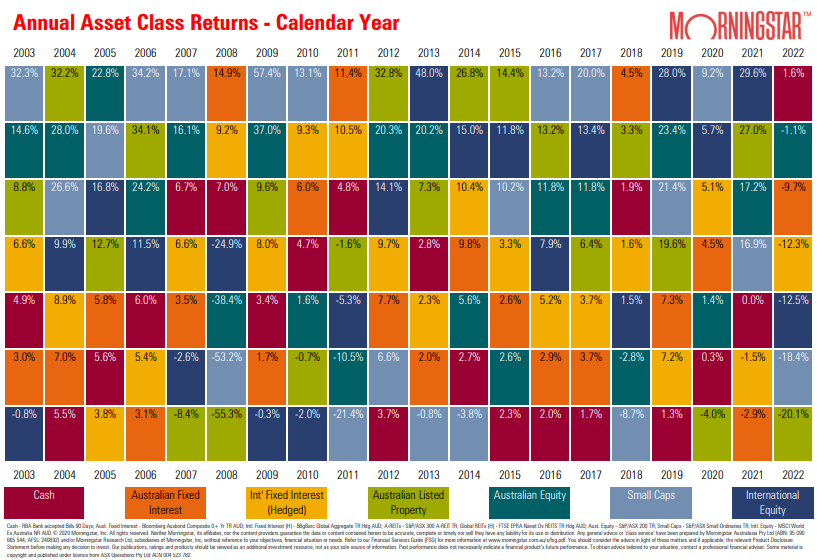
It’s an annual highlight when Morningstar releases its Asset Class Gameboard, showing the winners and losers across seven major asset classes over the last 20 years. A glance at the chart immediately tells investors that the leading and lagging asset classes change most years, and it is almost impossible to pick which class will be the 2023 winner. At the start of 2022, how many experts would have nominated cash as the 2022 best performer?

What else does the Gameboard tell investors?

While the chart will not identify future winners, it gives some useful lessons over the years (the chart shows global returns hedged into Australian dollars):

  • Good-to-bad-to-good is common. Many fund managers who shot the lights out in 2020 and 2021 became media darlings, regularly interviewed for their remarkable insights into the future, until the shocks of 2022 made them look like mere mortals. It’s the same with asset classes, suggesting there’s more to luck and randomness than analysts like to acknowledge.
  • Defensive cash won in 2022 but it was at the bottom in four of the five years from 2015 to 2019, and near the bottom until 2021. Cash also did relatively well in 2007 and 2008 during the GFC, but interest rates were noticeably higher. These better returns (in nominal terms) will continue in future putting cash back into the asset allocation game.
  • Australian listed property was bottom in 2020, near the top in 2021 and bottom again in 2022. Good luck picking those wild swings over only three years, suggesting the market’s ability to pick the trends and value real estate cash flows leaves a lot to be desired. Does it also mean that super funds which do not regularly revalue their unlisted property assets are right not to react to market prices every month?
  • Small caps topped 2020 as the pandemic favoured particular niches and growth companies, but they slipped rapidly down the chart in 2021 and 2022 as business models were tested, funding costs rose and some traditional consumer habits returned.
  • There’s a temptation to think returns from Australian and international equities should be approximately the same, as similar factors affect companies around the world. In fact, performance is often remarkably different, with 2022 as a stark example, especially as the currency impact of hedging into Australian dollars is in the numbers.
  • 2022 was the first time only one asset class delivered positive returns (although Australian equities rose when dividends are included) and the lowest return from the winner. This is on the back of exceptionally good returns in 2021.
  • Bond losses, both local and global, were the worse in 2022 over this entire series.

The average per annum performance of each asset class over this sample as in the table below, listed from highest to lowest. As with most long-term series, equities win.

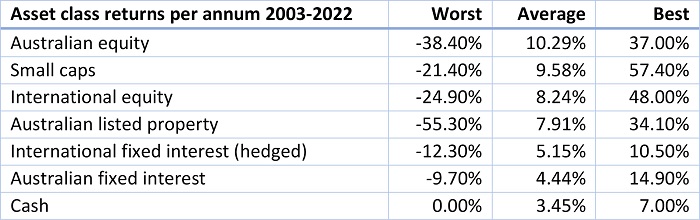
The overarching lesson for most investors looking for consistent returns and balanced risk is that diversification will reduce heavy annual losses that come from concentration, although the best long-term returns are derived from exposure to equities if the risk is not outside the comfort zone. 

Any comments on other information in the charts are welcome.


Graham Hand is Editor-at-Large for Firstlinks. This article is general information and does not consider the circumstances of any other investor.


RELATED ARTICLES

Not all private markets are ‘volatility laundering’

Diversification lessons from the GFC

Asset allocation in a world of riskier developed markets

banner

Most viewed in recent weeks

The case for the $3 million super tax

The Government's proposed tax has copped a lot of flack though I think it's a reasonable approach to improve the long-term sustainability of superannuation and the retirement income system. Here’s why.

7 examples of how the new super tax will be calculated

You've no doubt heard about Division 296. These case studies show what people at various levels above the $3 million threshold might need to pay the ATO, with examples ranging from under $500 to more than $35,000.

The revolt against Baby Boomer wealth

The $3m super tax could be put down to the Government needing money and the wealthy being easy targets. It’s deeper than that though and this looks at the factors behind the policy and why more taxes on the wealthy are coming.

Meg on SMSFs: Withdrawing assets ahead of the $3m super tax

The super tax has caused an almighty scuffle, but for SMSFs impacted by the proposed tax, a big question remains: what should they do now? Here are ideas for those wanting to withdraw money from their SMSF.

The super tax and the defined benefits scandal

Australia's superannuation inequities date back to poor decisions made by Parliament two decades ago. If super for the wealthy needs resetting, so too does the defined benefits schemes for our public servants.

Are franking credits hurting Australia’s economy?

Business investment and per capita GDP have languished over the past decade and the Labor Government is conducting inquiries to find out why. Franking credits should be part of the debate about our stalling economy.

Latest Updates

Superannuation

Here's what should replace the $3 million super tax

With Div. 296 looming, is there a smarter way to tax superannuation? This proposes a fairer, income-linked alternative that respects compounding, ensures predictability, and avoids taxing unrealised capital gains. 

Superannuation

Less than 1% of wealthy families will struggle to pay super tax: study

An ANU study has found that families with at least one super balance over $3 million have average wealth exceeding $19 million - suggesting most are well placed to absorb taxes on unrealised capital gains.   

Superannuation

Are SMSFs getting too much of a free ride?

SMSFs have managed to match, or even outperform, larger super funds despite adopting more conservative investment strategies. This looks at how they've done it - and the potential policy implications.  

Property

A developer's take on Australia's housing issues

Stockland’s development chief discusses supply constraints, government initiatives and the impact of Japanese-owned homebuilders on the industry. He also talks of green shoots in a troubled property market.

Economy

Lessons from 100 years of growing US debt

As the US debt ceiling looms, the usual warnings about a potential crash in bond and equity markets have started to appear. Investors can take confidence from history but should keep an eye on two main indicators.

Investment strategies

Investors might be paying too much for familiarity

US mega-cap tech stocks have dominated recent returns - but is familiarity distorting judgement? Like the Monty Hall problem, investing success often comes from switching when it feels hardest to do so.

Latest from Morningstar

A winning investment strategy sitting right under your nose

How does a strategy built around systematically buying-and-holding a basket of the market's biggest losers perform? It turns out pretty well, so why don't more investors do it?

Sponsors

Alliances

© 2025 Morningstar, Inc. All rights reserved.

Disclaimer
The data, research and opinions provided here are for information purposes; are not an offer to buy or sell a security; and are not warranted to be correct, complete or accurate. Morningstar, its affiliates, and third-party content providers are not responsible for any investment decisions, damages or losses resulting from, or related to, the data and analyses or their use. To the extent any content is general advice, it has been prepared for clients of Morningstar Australasia Pty Ltd (ABN: 95 090 665 544, AFSL: 240892), without reference to your financial objectives, situation or needs. For more information refer to our Financial Services Guide. You should consider the advice in light of these matters and if applicable, the relevant Product Disclosure Statement before making any decision to invest. Past performance does not necessarily indicate a financial product’s future performance. To obtain advice tailored to your situation, contact a professional financial adviser. Articles are current as at date of publication.
This website contains information and opinions provided by third parties. Inclusion of this information does not necessarily represent Morningstar’s positions, strategies or opinions and should not be considered an endorsement by Morningstar.