Register For Our Mailing List

Register to receive our free weekly newsletter including editorials.

Home / 312

We have many world best practice companies

Overall, Australia’s businesses are way below world best practice (WBP) when it comes to profitability and have been for decades. Average returns on shareholder funds after tax (ROSF or Return on Investment, ROI) across the nation’s 2.3 million businesses have averaged just 3.7% over the past three decades (compared with the 10-year government bond rate averaging 5.5% over that period), although with a better 4.2% in 2018. Our largest 2,000 corporations averaged 6.9% ROI, and our Best 100 did a little better at 8%. The WBP level is 22%.

What do we mean by world best practice?

In this article, I have treated WBP as a company profitability level above 22% ROI, not a single 'best' as we might do with best practice in other comparisons (such as OH&S, triple bottom line, stakeholder action). Even with best practice processes and products there are often subtle if not significant differences.

It's instructive to see how WBP has evolved through the ages of economic progress.

  • The Agrarian Age, up to the late 18th century. WBP profitability was probably around the 10-year bond rate of about 5.5%.
  • The Industrial Age, up to the mid 1960s. WBP profitability was around double the bond rate, at about 11%.
  • The current Infotronics Age, to the middle of the 21st century. WBP profitability has doubled again to 22%. The added returns come from intellectual property, brand strength, culture, etc, which often remain off balance sheet although shareholders accept them as real in valuing a company. The massive change has been in the value of intellectual property ahead of the audited net assets.

Global performance comparisons

All of the ROI averages of Australian companies stated in the first paragraph are just over half the averages in the USA.

However, Australia had more than one in 10 of our largest 2,000 - that account for 46% of the nation’s $5.3 trillion revenue in 2018 - achieving WBP of 22% in ROI terms over the 3-year period to 2018. Sadly, three in 10 lost money over the same period.

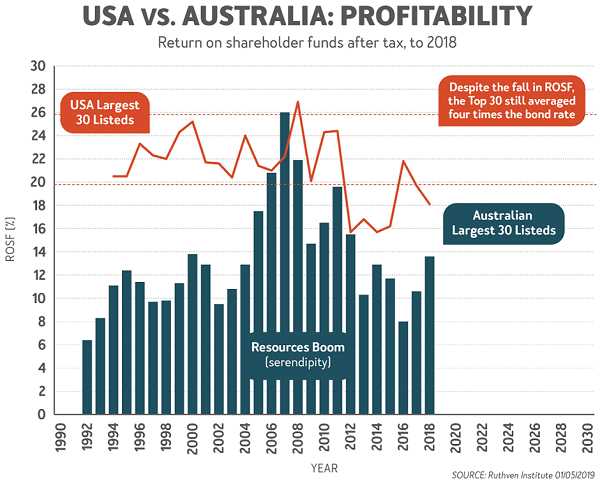
We see the same performance gap in our 30 largest listed stocks (by market capitalisation) compared with the 30 largest NYSE-listed stocks (the Dow Jones Index list) below.

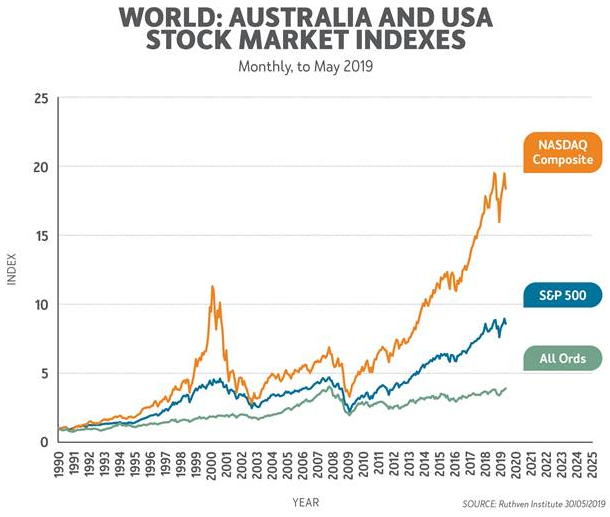
So, a lot of share portfolios and SMSFs have become more heavily weighted into US equities in recent times (directly or via managed funds and ETFs). That has been a no-brainer when one sees the diversity of performance between the All Ordinaries, S&P500 and NASDAQ in the next chart.

Tell us some good news about Australia

But, as always, there is good news as well as sobering news as shown below.

world best practice

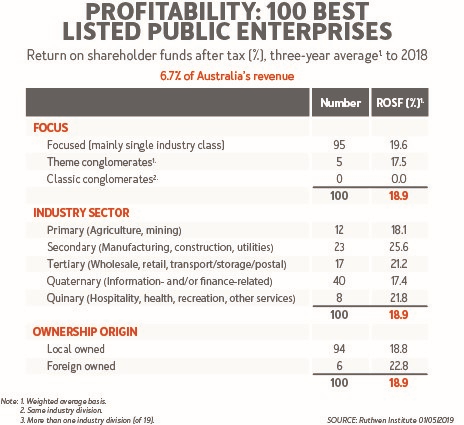
Some 42 companies in the Best 100 Listed Stocks achieved or bettered the WBP of 22% ROI in the three years to 2018, and the weighted average of the 100 was a commendable 18.9%.

The good performance took place across all five industry sectors with the toughest sector - the secondary sector of manufacturing, utilities and construction - performing best. Most of the 100 Best were focused companies with only five being diversified, and even they were theme conglomerates rather than dangerous classic conglomerates which all fail eventually.

The best news of all is when we look at the Best 50 Listed companies over a 5-year period to 2018, and compare their weighted performance with the All Ordinaries Index, as below.

world best practice

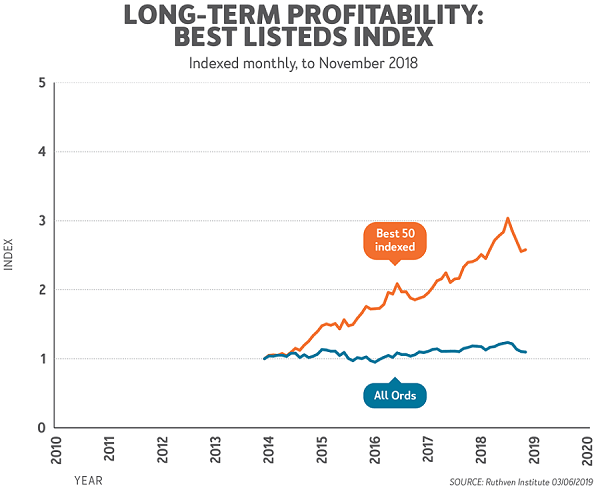
A million dollars invested in the Best 50 five years ago would have yielded a capital value of $2.5 million by 2018, a 30% pa return, plus dividends. The All Ords would have been worth just $1.15 million plus dividends.

Our Best 50 not only outpaced the S&P500, but also the NASDAQ. It would seem fundamentals do matter.


Phil Ruthven is Founder of the Ruthven Institute, Founder of IBISWorld and widely-recognised as Australia’s leading futurist.

A full 40-page online Summary of the latest Business Performance results is available from www.ruthven.institute along with a staggering amount of other strategic information.

RELATED ARTICLES

Why stock prices are a distraction

Is the speculative fever in 'hot stocks’ over?

Gullible travels, or are Aussies more sceptical?

banner

Most viewed in recent weeks

Raising the GST to 15%

Treasurer Jim Chalmers aims to tackle tax reform but faces challenges. Previous reviews struggled due to political sensitivities, highlighting the need for comprehensive and politically feasible change.

7 examples of how the new super tax will be calculated

You've no doubt heard about Division 296. These case studies show what people at various levels above the $3 million threshold might need to pay the ATO, with examples ranging from under $500 to more than $35,000.

Are franking credits hurting Australia’s economy?

Business investment and per capita GDP have languished over the past decade and the Labor Government is conducting inquiries to find out why. Franking credits should be part of the debate about our stalling economy.

Here's what should replace the $3 million super tax

With Div. 296 looming, is there a smarter way to tax superannuation? This proposes a fairer, income-linked alternative that respects compounding, ensures predictability, and avoids taxing unrealised capital gains. 

The rubbery numbers behind super tax concessions

In selling the super tax, Labor has repeated Treasury claims of there being $50 billion in super tax concessions annually, mostly flowing to high-income earners. This figure is vastly overstated.

9 winning investment strategies

There are many ways to invest in stocks, but some strategies are more effective than others. Here are nine tried and tested investment approaches - choosing one of these can improve your chances of reaching your financial goals.

Latest Updates

Taxation

100 Aussies: seven charts on who earns, pays, and owns

The Labor government is talking up tax reform to lift Australia’s ailing economic growth. Before any changes are made, it’s important to know who pays tax, who owns assets, and how much people have in their super for retirement.

7 key charts on the state of the Australian property market

The Australian property market stirs fierce debate - often bullish optimism versus crash predictions. But beyond the noise, seven charts reveal what's really driving prices and the outlook for residential real estate.

A simple alternative to the $3 million super tax

Division 296 aims to introduce improved fairness into the superannuation system, yet is overly complex. This scours the world for better ideas and suggests a simpler alternative which can achieve the same goals.

CBA and the index conundrum for super funds

After the hyperbolic rise in CBA shares, super funds are floating the idea of carving out the weightings of ASX bank securities and indexing them within their portfolios. This looks at why that might be a big error.

Strategy

10 policies to drive Australian productivity higher

Here's a comprehensive list of proposed reforms to fix Australia's stagnating economy, including introducing a flat income tax rate, reducing migration, and making childcare tax-deductible.

Interviews

Where to find big winners in Asia

As more money looks for a home outside the US, Asia may soon get some love. Fidelity's Anthony Srom outlines the best places in Asia to invest, including in Chinese consumer names, Indian financials, and Thailand.

Investment strategies

We have trouble understanding the time value of money

We overvalue the present and underestimate the future - it’s a cognitive glitch called hyperbolic discounting. It affects savings, spending, and loans, and it's more common - and costly - than we think. 

Sponsors

Alliances

© 2025 Morningstar, Inc. All rights reserved.

Disclaimer
The data, research and opinions provided here are for information purposes; are not an offer to buy or sell a security; and are not warranted to be correct, complete or accurate. Morningstar, its affiliates, and third-party content providers are not responsible for any investment decisions, damages or losses resulting from, or related to, the data and analyses or their use. To the extent any content is general advice, it has been prepared for clients of Morningstar Australasia Pty Ltd (ABN: 95 090 665 544, AFSL: 240892), without reference to your financial objectives, situation or needs. For more information refer to our Financial Services Guide. You should consider the advice in light of these matters and if applicable, the relevant Product Disclosure Statement before making any decision to invest. Past performance does not necessarily indicate a financial product’s future performance. To obtain advice tailored to your situation, contact a professional financial adviser. Articles are current as at date of publication.
This website contains information and opinions provided by third parties. Inclusion of this information does not necessarily represent Morningstar’s positions, strategies or opinions and should not be considered an endorsement by Morningstar.